

Traders have been keeping the ETH/BTC ratio within a narrow adjustment range since mid-May, which highlights the continued underperformance of altcoins against market leaders.
This stagnation reflects a weakening investor interest in ETH and indicates a delay in the start of a full-fledged altcoin season.
Ethereum Sluggish...Altcoin Season on Hold
According to the daily chart, the ETH/BTC ratio has been moving within a narrow range since May 13th. It is experiencing resistance at 0.026 and support at 0.023.

This ratio measures ETH's price performance compared to BTC, indicating which asset is gaining value more quickly. Historically, a sustained rise in the ETH/BTC ratio has served as a precursor to a broader altcoin rally, with ETH often leading capital rotation ahead of BTC.
However, the current sideways trend suggests that traders are still risk-averse and focusing on BTC, especially as geopolitical tensions persist.
This trend is notable, as it suggests that the highly anticipated altcoin season may be further delayed.
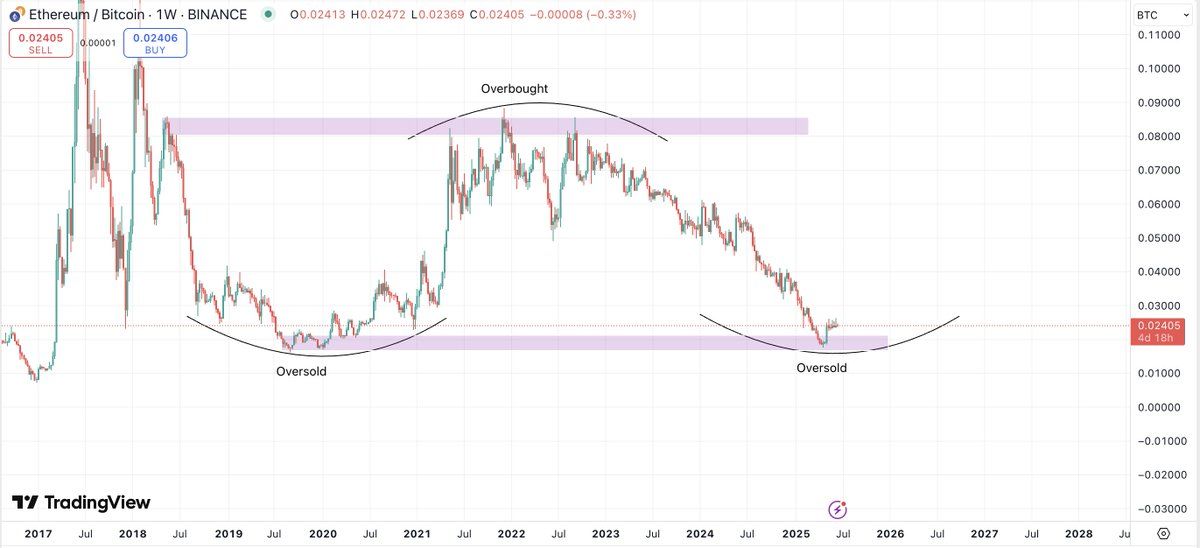
According to a post by Crypto Fella on X on June 18th, the analyst emphasized that the ETH/BTC chart is the "most important chart" for those expecting the return of the altcoin season.
According to the chart reading, this pair is hovering around the 0.024 level, where the bottom of the previous cycle was formed. In similar structures from 2019 and 2020, ETH strongly rebounded compared to BTC. However, Crypto Fella points out that it needs to show strong performance "before seeing a big reversal".
Therefore, decisively breaking through the key resistance of 0.026 is crucial in signaling the start of a broader altcoin revival.
Additionally, according to the altcoin season index reading, the market is still in the BTC dominance phase. The altcoin season begins when at least 75% of the top 50 altcoins outperform BTC for three months.

Only 25% have achieved this in the past 90 days, which clearly shows a delay in altcoin performance and suggests that a true altcoin season is still far away.
ETH Struggling Below 20-Day Moving Average
ETH is trading at $2,521 at the time of reporting, recording a slight increase of 0.15% over the past day. On the ETH/USD daily chart, the altcoin is trading below the 20-day Exponential Moving Average (EMA), confirming weakness amid geopolitical tensions in the Middle East.
The 20-day EMA gives more weight to recent prices, measuring the average price of the asset over the past 20 trading days. When the price is trading below the 20-day EMA, it indicates short-term bearish momentum and suggests sellers are in control.
If this situation continues, ETH could drop to $2,424.

However, if demand increases, ETH's price could break through the 20-day EMA and rebound to $2,745.


