

Today, Bitcoin is experiencing increased selling pressure as physical market outflows become notably significant. This comes amid market challenges triggered by the geopolitical uncertainty following Israel's Iranian strike on Friday.
Bitcoin has declined by 3% over the past 24 hours, and technical indicators suggest weakening buying momentum. If bearish pressure continues, Bitcoin may experience further decline and potentially test lower support levels in the coming days.
Bitcoin Facing More Losses as Indicators Turn Red
Over the past 24 hours, BTC has fallen nearly 5%, hovering around $105,000. As risk aversion sentiment increases, capital is flowing out of the physical market, and trader and institutional participant confidence is weakening.
On the daily chart, BTC's Relative Strength Index (RSI) has sharply dropped below the neutral level of 50, confirming a declining buying momentum. At the time of writing, this indicator is at 48.85, showing a downward trend.
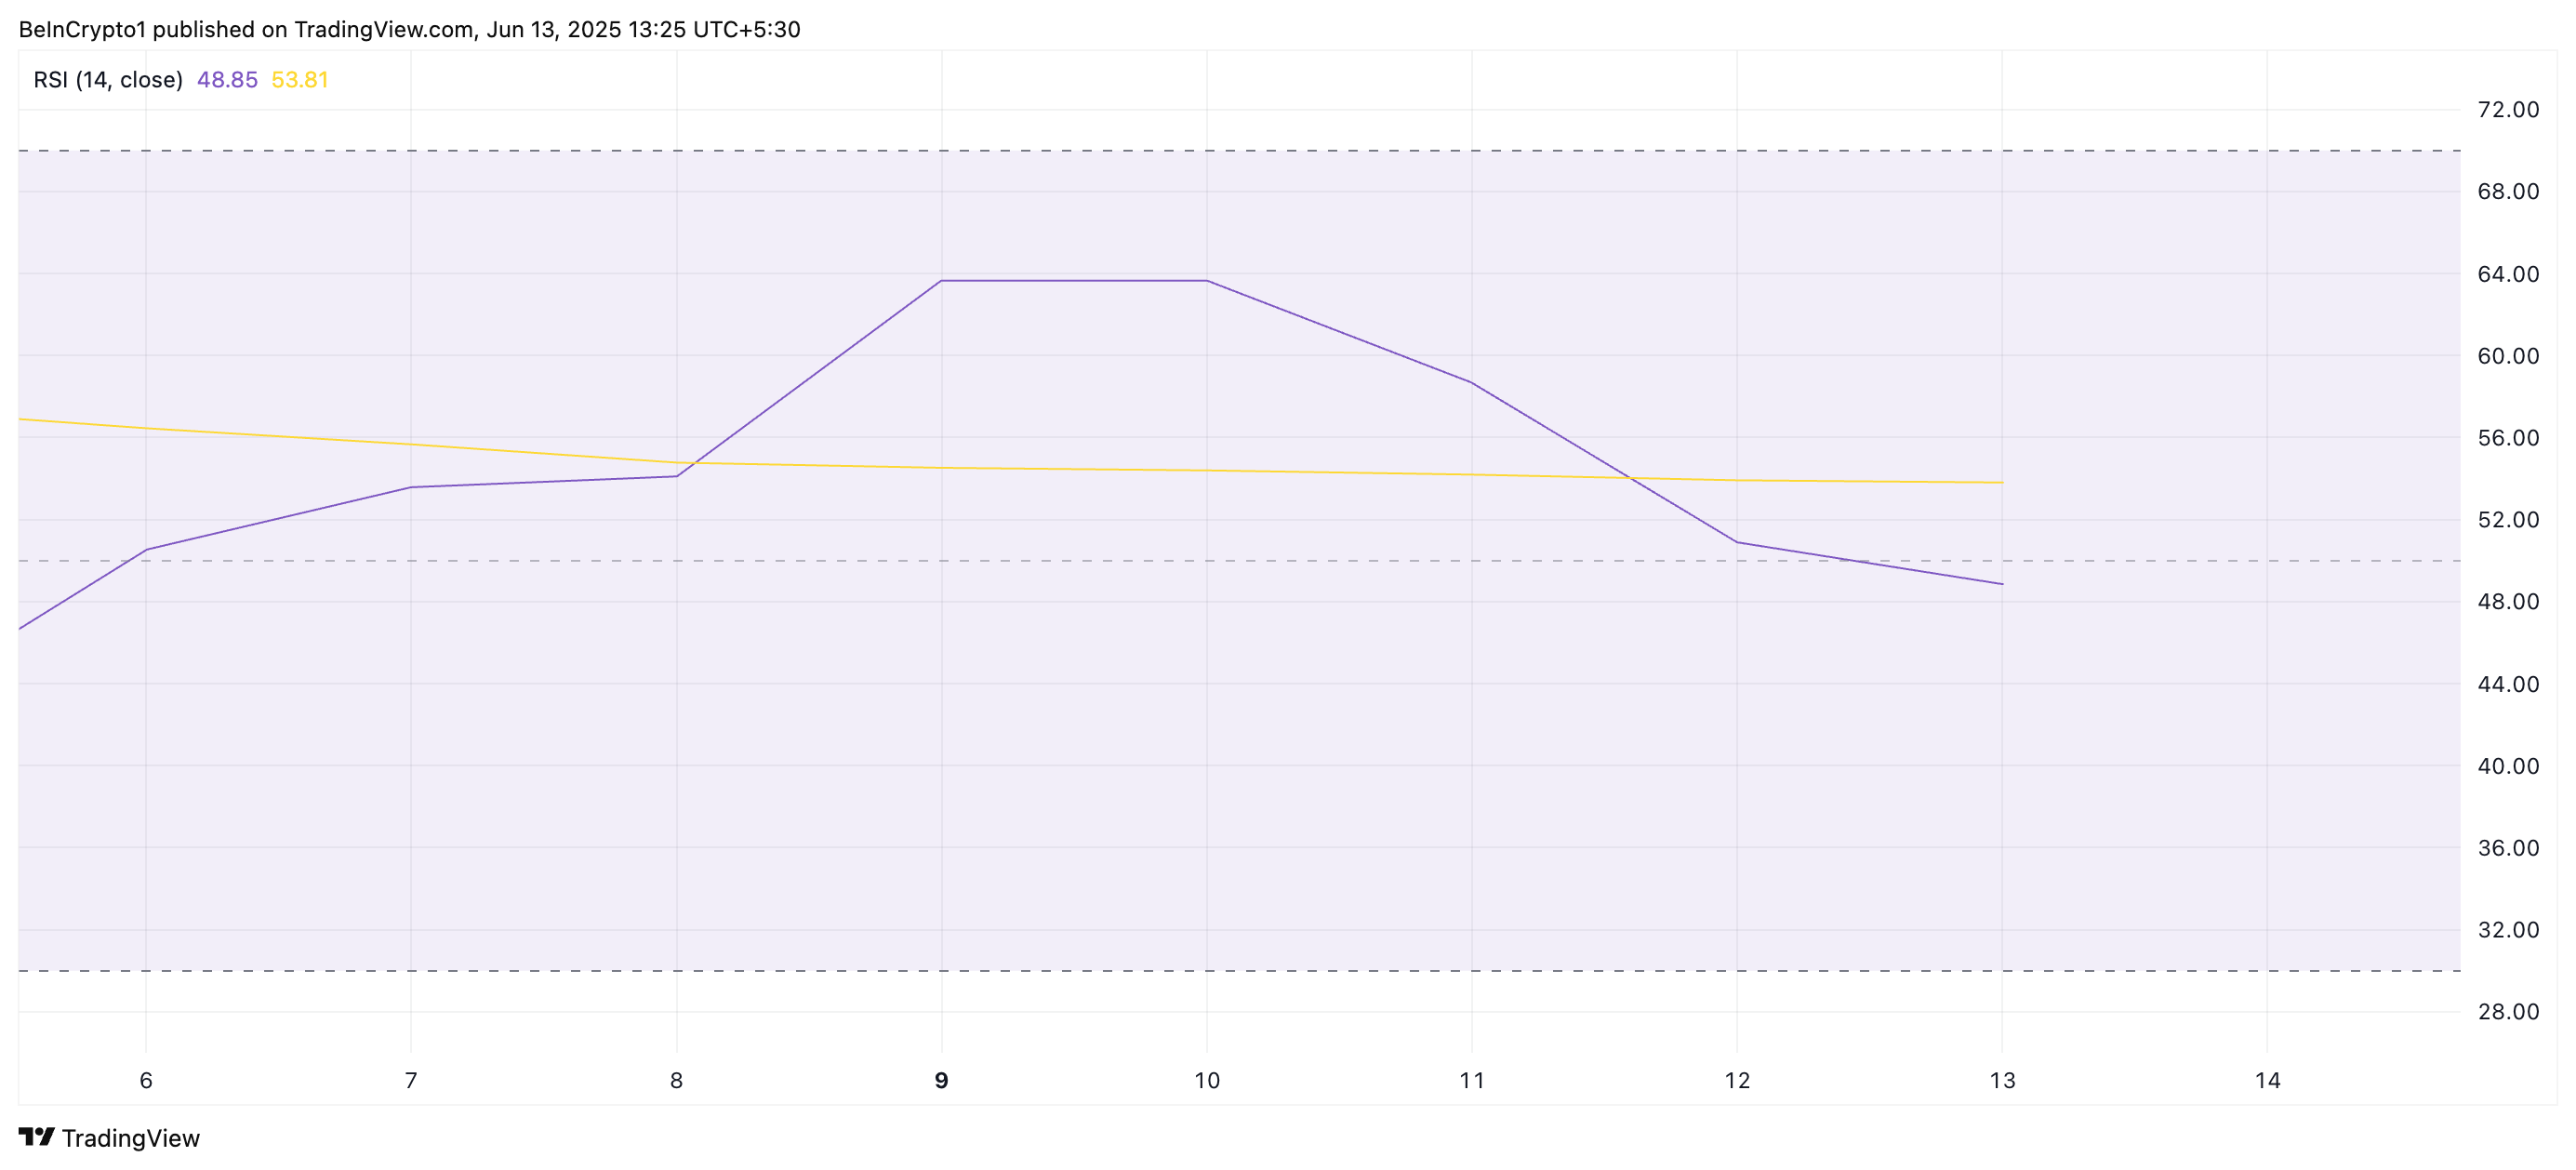
The RSI indicator measures overbought and oversold market conditions for an asset. On a scale from 0 to 100, exceeding 70 indicates an overbought state and potential price decline. Conversely, below 30 suggests an oversold state and potential rebound.
BTC's current RSI value reflects weakening bullish momentum and implies a potential short-term price decline.
Additionally, the Moving Average Convergence Divergence (MACD) settings support this bearish outlook. Currently, BTC's MACD line (blue) is below the signal line (orange), indicating selling-side pressure is predominant.

The asset's MACD indicator identifies price movement trends and momentum. Traders can capture potential buy or sell signals through crossovers between the MACD and signal lines. In this configuration, selling activity dominates the market, suggesting further price decline.
BTC Bears Strengthen Grip with Price Decline
BTC is currently trading at $105,304 and recording its third consecutive red candle on the daily chart. As demand for the coin continues to decrease, it risks falling to the support level of $103,061. If the uptrend fails to defend this level, it could decline further to $101,610.

However, if new demand emerges, BTC could break out of its decline and move towards the resistance level of $106,548.


