Bitcoin (BTC) continues to trade sideways around $90,000 at the time of writing on Friday, as retail investors are watching for the Federal Reserve's cautious interest rate cut in December and its impact on risk assets.
The price of BTC is currently approaching a key descending trend line, which could determine the coin's next direction. Simultaneously, institutional inflows into spot Bitcoin ETFs continue to see a slight increase, and Strategy continues to add BTC to its reserves.
The Fed's policy stance is driving a correction in Bitcoin.
Bitcoin prices started the week on a positive note, extending their recovery from the weekend and remaining above the $92,600 mark on Tuesday.
However, the upward momentum weakened on Wednesday, as BTC closed at $92,015 following the Federal Open Market Committee (FOMC) meeting.
In a move that had been anticipated, the Fed lowered interest rates by 25 basis points . However, the FOMC meeting indicated a high likelihood of pausing further rate cuts in January 2026.
Adding to the caution, policymakers forecast only a single interest rate cut of 0.25% for the entire year of 2026. This assessment is similar to that of September, thus reducing expectations of two Fed rate cuts and putting short-term pressure on risky assets.
The cautious tone from the Fed, combined with Oracle's disappointing earnings results, led to a short-term negative market reaction.
All of these factors negatively impacted risky assets, particularly Bitcoin – the largest cryptocurrency by market Capital – which fell to a weekly low of $89,260 before rebounding and closing above $92,500 on Thursday.
With no major economic data releases expected in the US, the crypto market will now primarily focus on statements from FOMC members and global risk sentiment developments to determine the trend.
this weekend.
It is highly likely that BTC will continue to trade sideways in the near future unless any significant new positive signals emerge.
Instability between Russia and Ukraine is limiting the upward momentum of risky assets.
From a geopolitical standpoint, U.S. President Donald Trump is "very disappointed" with Russia and Ukraine and does not want to hear any more negotiations, according to his spokesman on Thursday.
Earlier, Ukrainian President Volodymyr Zelenskyy said that the US was pressuring Ukraine to cede territory to Russia as part of an agreement to end the nearly four-year-long war.
Current geopolitical tensions and stalled peace negotiations continue to put pressure on global risk appetite, making retail investors more cautious and causing Bitcoin prices to remain sideways this week .
Demand from organizations is showing a slight improvement.
Institutional demand for Bitcoin is showing a slight improvement.
According to data from SoSoValue, US-listed spot Bitcoin ETFs recorded total Capital of $237.44 million as of Thursday, after experiencing outflows of $87.77 million the previous week. This suggests that interest from institutional investors is gradually improving.
However, this weekly inflow of funds is still quite small compared to the period in mid-September. For BTC prices to continue their strong recovery, the inflow of funds into ETFs needs to increase significantly.
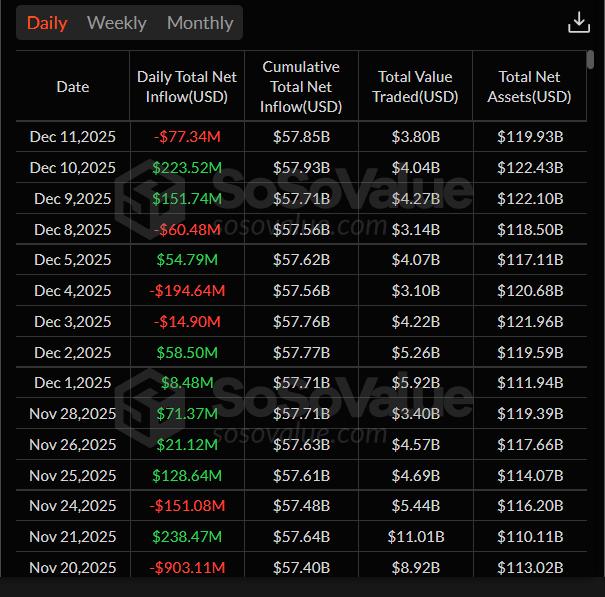 Chart showing net Capital inflows for spot Bitcoin ETFs. Source: SoSoValue
On the business side, Strategy Inc. (MSTR) announced on Monday that it purchased 10,624 Bitcoin for a total value of $962.7 million between December 1st and December 7th at an Medium price of $90,615 per Bitcoin.
Currently, the company holds 660,624 BTC with a total value of up to $49.35 billion. Strategy still has plenty of room to raise more Capital and is likely to continue buying more Bitcoin on a large scale in the near future.
on-chain data suggests selling pressure is gradually decreasing.
CryptoQuant's weekly report, released on Wednesday, indicated that selling pressure on Bitcoin has begun to ease .
The report states that the amount of BTC deposited into exchanges has decreased due to "whales" reducing the amount of coins being transferred to the exchanges.
The chart below shows that the deposit rate of large investors has decreased from an Medium of 47% (over 24 hours) in mid-November to 21% on Wednesday.
At the same time, the Medium deposit amount per transaction has decreased by 36%, from 1.1 BTC on November 22nd to 0.7 BTC currently.
 BTC is being deposited onto exchanges. Source: CryptoQuant
CryptoQuant predicts that if selling pressure remains low, Bitcoin could potentially recover to $99,000. This is the lower end of the Trader on-chain Realized Price Bands, which often Vai as price resistance in bear markets.
After this price level, the next key resistance zones will be $102,000 (1-year moving Medium ) and $112,000 (Trader on-chain Realized price).
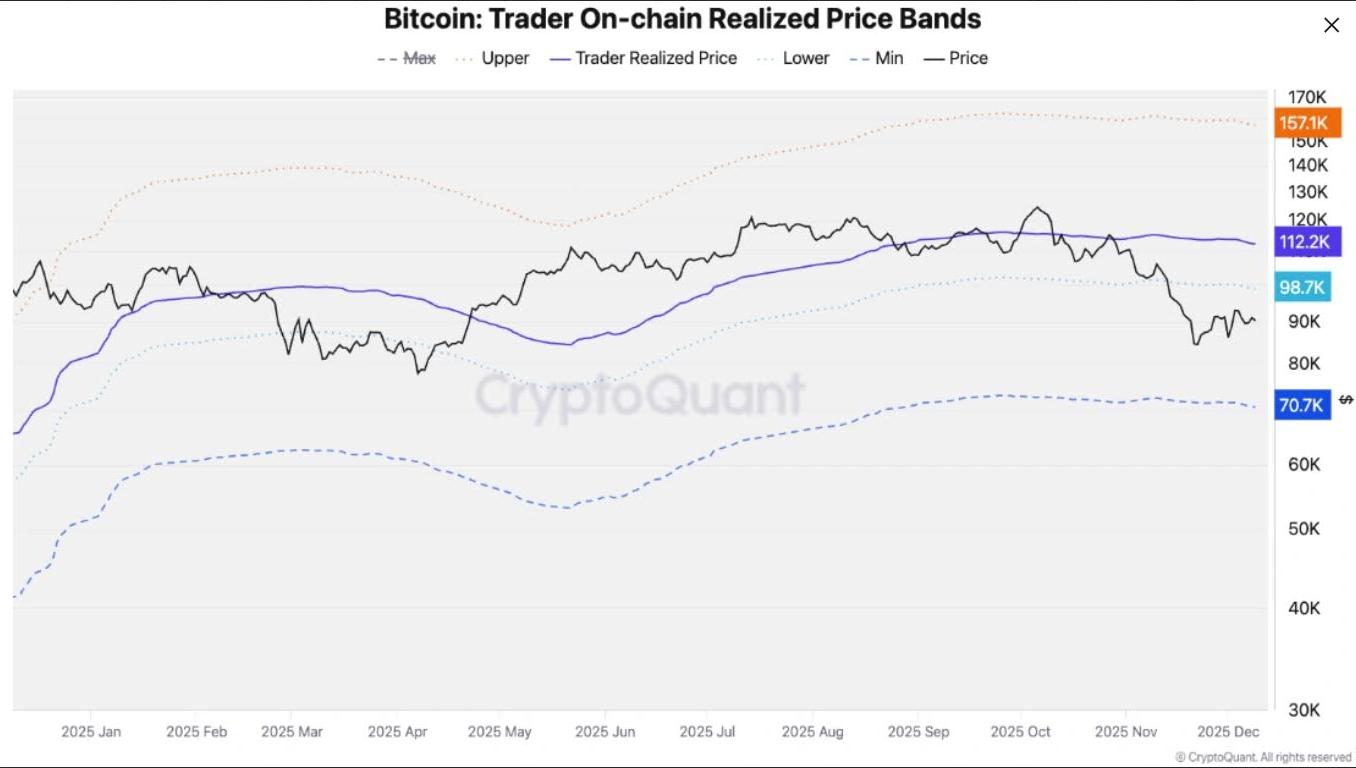 Realized price ranges for Bitcoin traders
Copper's research report also showed optimism about Bitcoin. The report suggested that BTC 's four-year cycle hasn't disappeared, but has simply been replaced by a different model.
Since the launch of spot ETFs, Bitcoin has formed recurring cycles of returns based on Capital , as illustrated in the chart below.
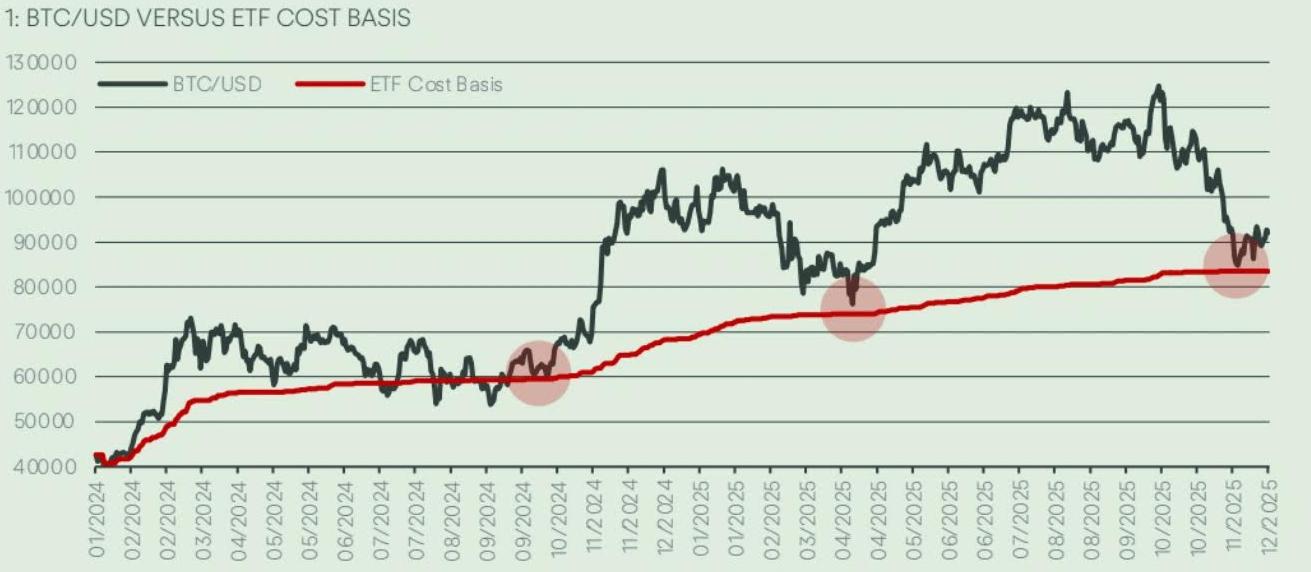 Bitcoin price in USD compared to ETF Capital
Fadi Aboualfa, head of research at Copper, Chia FXStreet: “Since the launch of spot ETFs, Bitcoin prices have typically moved in small cycles, repeatedly returning to their Capital basis before surging by around 70%.”
Currently, with BTC trading near its cost Capital of $84,000, this pattern suggests the possibility of the price rising above $140,000 within the next 180 days.
If the cost Capital increases by approximately 10-15% as in previous cycles, the all-time high would target Bitcoin prices in the range of $138,000 – $148,000.
Will Bitcoin experience a price surge at the end of the year?
Bitcoin fell 17.67% in November, disappointing many retail investors who had expected a sharp price increase based on this month's historical data (according to CoinGlass data below).
Meanwhile, history shows that December usually brings positive results for Bitcoin, with Medium returns of around 4.55%.
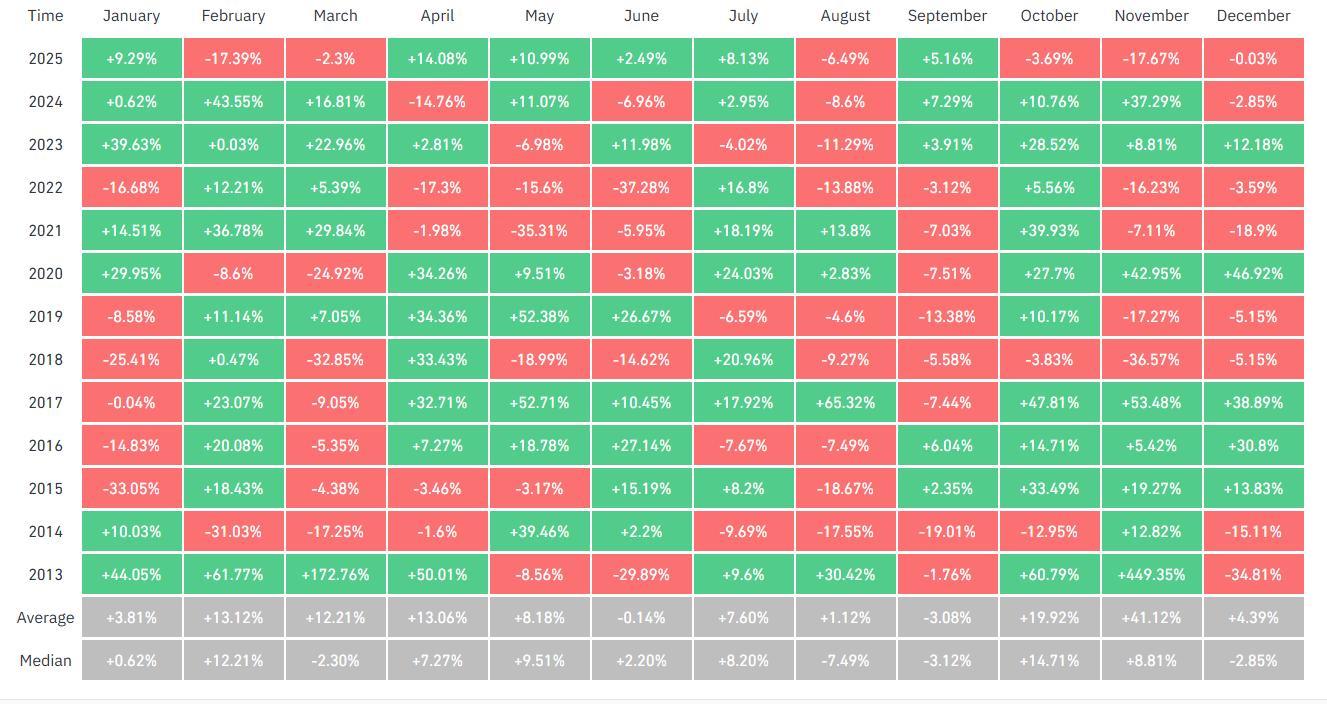 Bitcoin's monthly returns. Source: CoinGlass
Looking at the quarters, Q4 was the best period for BTC with an Medium return of up to 77.38%.
However, the last three months of 2025 so far have not been very promising, with BTC falling by 19%.
Is BTC bottoming Dip?
The weekly chart of Bitcoin shows that the price is finding support around the 100-week Exponential Moving Average (EMA) at $85,809. Simultaneously, two consecutive green candles have appeared after a four-week correction since the end of October.
At the time of writing this week, BTC is trading slightly higher, holding firm above $92,400.
If BTC continues to recover, the upward momentum could head towards the 50-week EMA at $99,182.
The Relative Strength Index (RSI) on the weekly chart is at 40 and trending upwards, indicating weakening selling pressure. For the price to continue its steady rise, the RSI needs to break above the neutral level of 50.
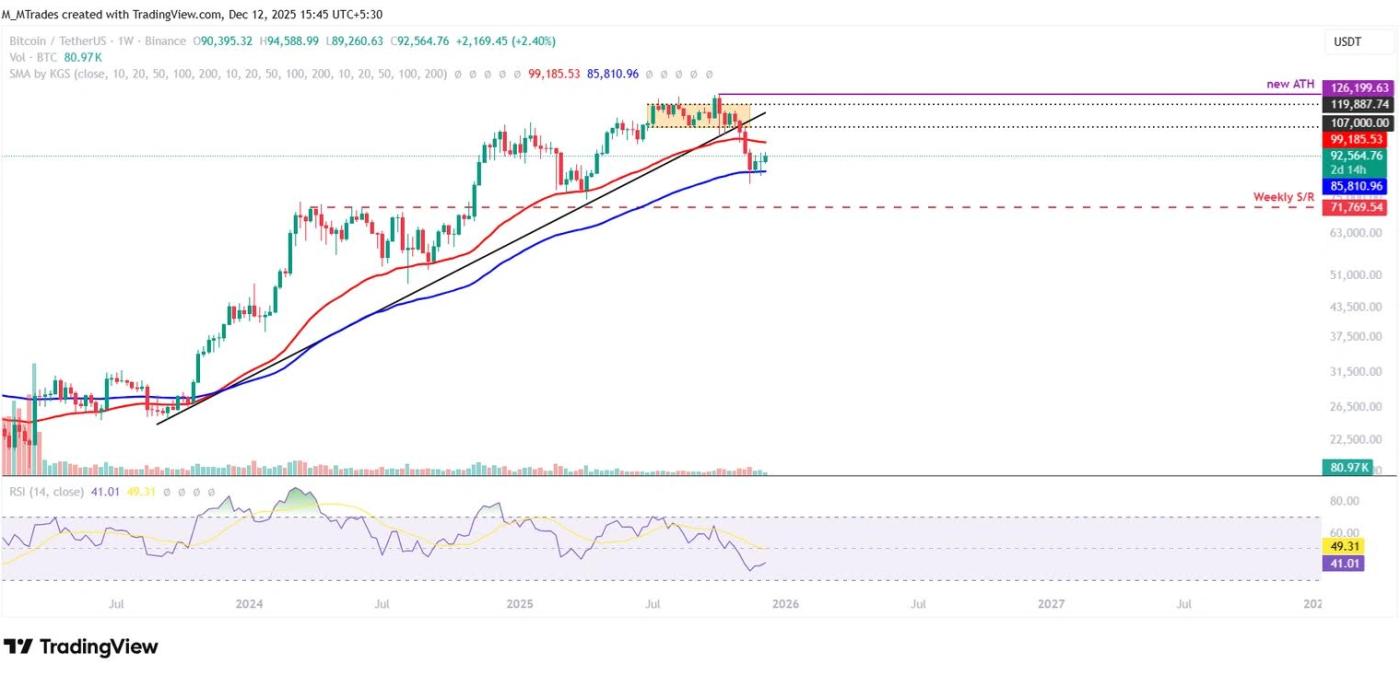 BTC/ USDT Weekly Chart
On the daily chart, Bitcoin's price was rejected at the 61.8% Fibonacci retracement level at $94,253 (calculated from the April Dip of $74,508 to the all-time high of $126,199 in October) on Wednesday.
However, on Thursday, BTC rebounded after retesting the psychological threshold of $90,000.
If BTC breaks through the descending resistance line (drawn from the peaks since the beginning of October) and closes above $94,253
The upward trend could continue to the psychological level of $100,000.
The Relative Strength Index (RSI) on the daily chart is holding steady around the neutral level of 50, indicating that neither buyers nor sellers have a clear advantage in the short term.
For the uptrend to become more robust, the RSI needs to clearly break above this neutral level.
At the same time, the Moving Average Convergence Divergence (MACD) indicator gave a bullish crossover signal at the end of November and is still maintaining it, reinforcing the scenario of continued upward price movement.
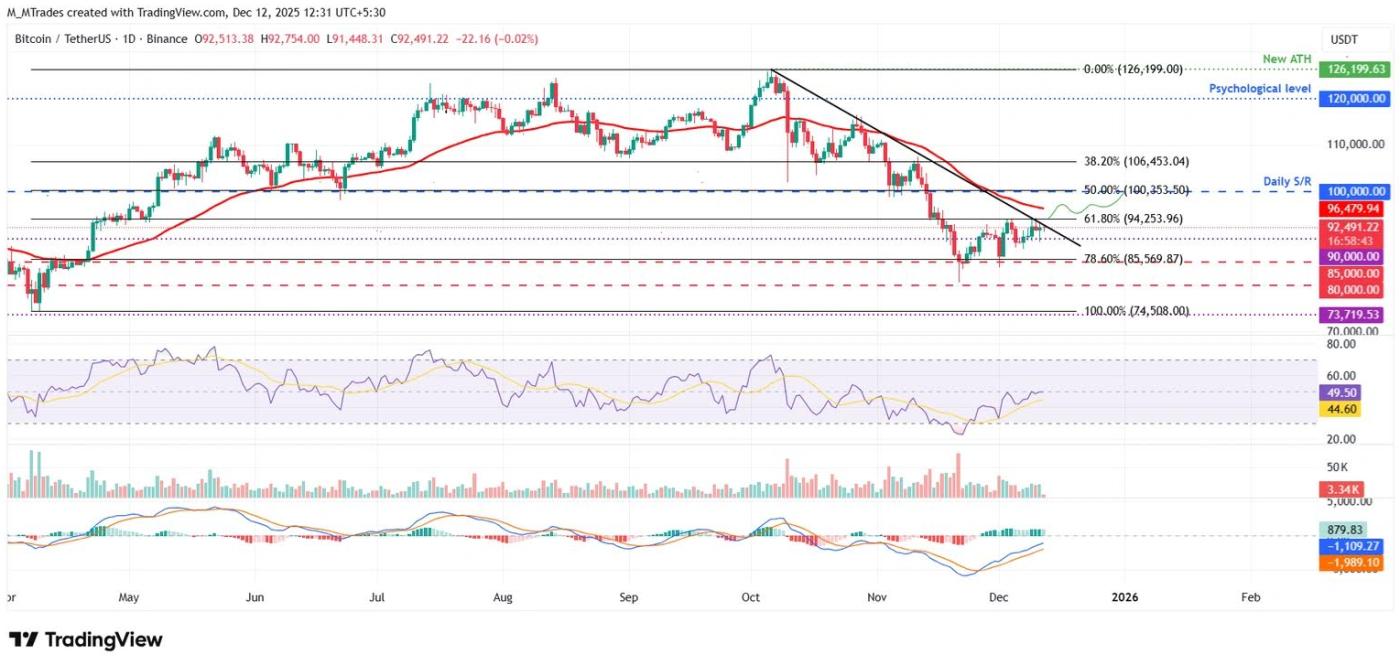 BTC/ USDT daily chart
If BTC returns to a downward correction trend, the first key support level is at $85,569, coinciding with the 78.6% Fibonacci retracement level.