HBAR price is almost flat today after a sharp drop of nearly 29% over the past month. Over the past week, HBAR has also fallen by about 6%. The current trend is weak, but the overall picture is more complex. Demand from retail investors remains quite weak, while whales have been buying heavily in the last two days.
The combination of weak momentum and this accumulation suggests that HBAR may be building a base, even though the price hasn't really strengthened yet.
Weak demand but strong accumulation?
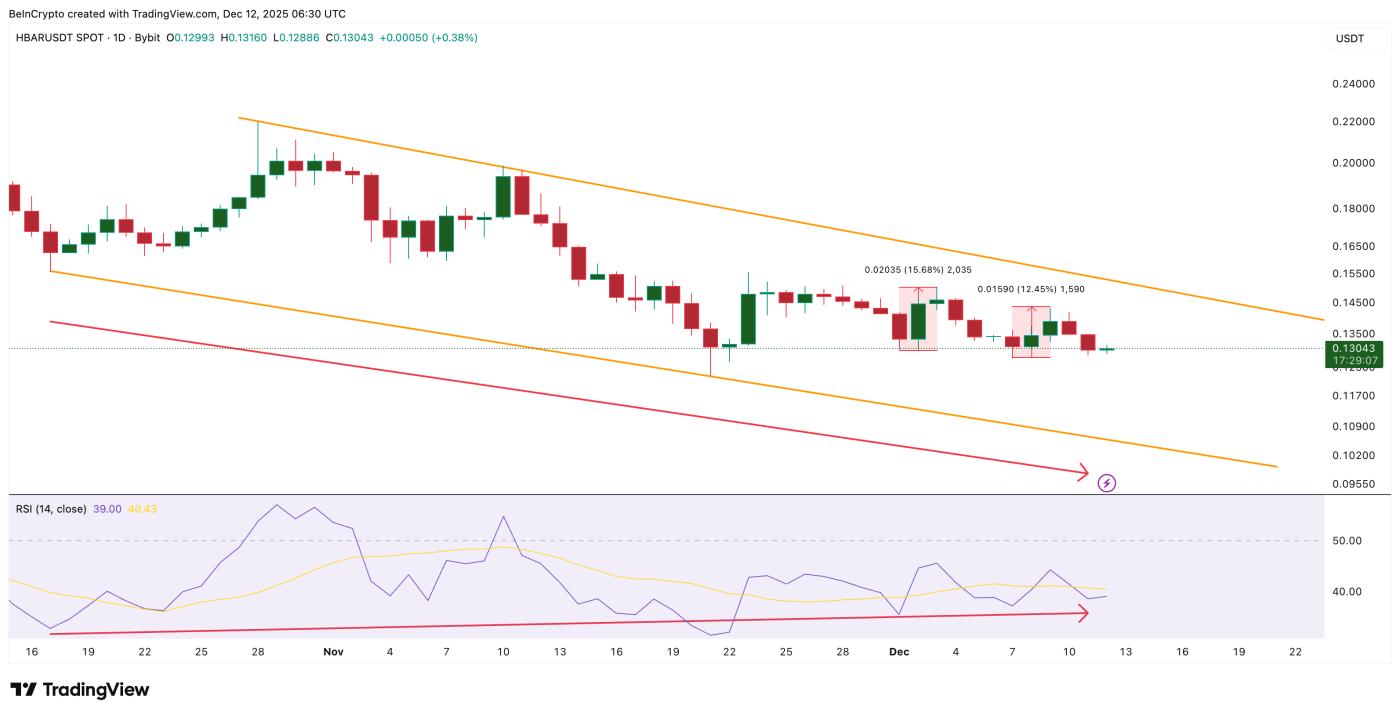
HBAR is currently moving within a Falling Wedge pattern. Wedges are typically a positive structure as they indicate weakening selling pressure over time. However, signs of weakness are emerging within this pattern. Between December 7th and 11th, 2023, HBAR price formed a higher Dip , while the OBV index formed a lower Dip .
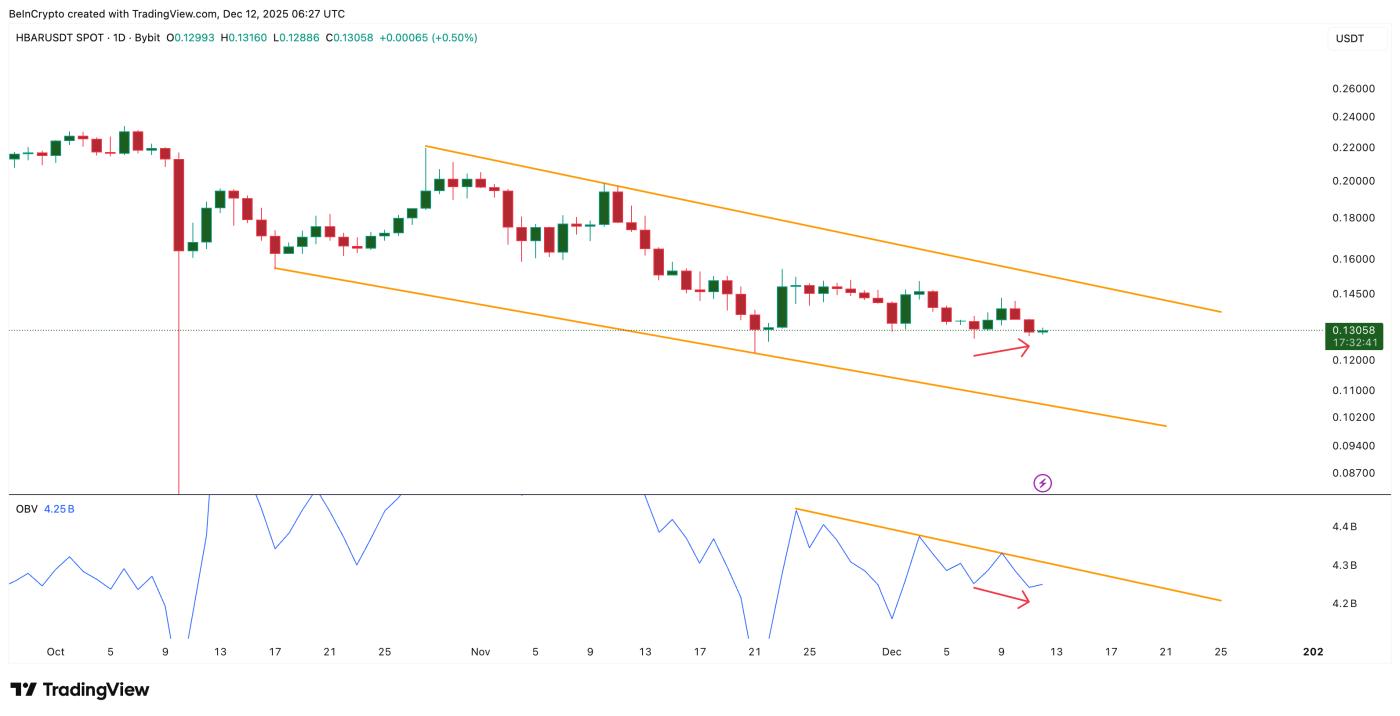 Demand from retail investors is weak: TradingView
Want more Token analysis? Sign up for editor Harsh Notariya's Daily Crypto newsletter here .
OBV is a tool that aggregates volume, helping to identify the inflow or outflow of money into a Token. When the price forms a higher Dip but the OBV decreases, it indicates that the buying pressure is not strong enough to support the rebound, creating a bearish divergence even when the overall pattern remains positive.
However, whales acted quite differently. Wallets holding at least 10 million HBAR saw their value increase from 136.54 to 149.49. Wallets holding at least 100 million HBAR increased from 40.65 to 73.62. In just this minimum amount, whales bought approximately 3.42 billion HBAR in less than 48 hours. At current prices, this HBAR is worth at least $445 million.
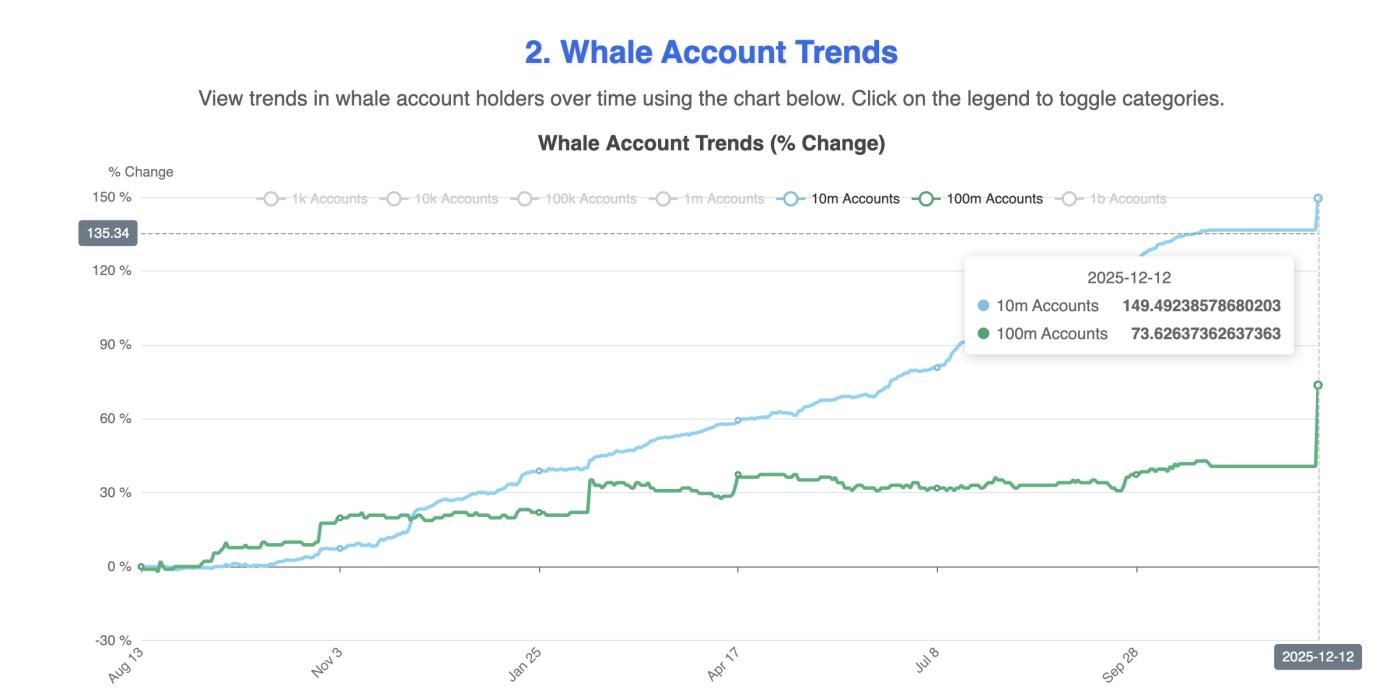 HBAR whales are very active: Hedera Watch
OBV only tracks volume on the exchange; large off-exchange or OTC/custody transactions may not be recorded on OBV. Therefore, OBV generally reflects the behavior of retail investors more accurately.
This contradiction is explained in the following section, as the whales may be anticipating deeper signals.
Repeating signals that whales may be tracking.
From October 17th to December 11th, 2023, the HBAR price formed lower Dip while the Relative Strength Index (RSI) formed higher Dip . The RSI measures the speed of buying and selling. When the price goes down but the RSI rises, this is a standard bullish divergence, often signaling a trend reversal.
This divergence pattern has appeared before previous rallies. On December 1st and December 7th, this pattern appeared, and HBAR price increased by 15% and 12% respectively. Although it was stopped at the resistance zone each time, this time the bullish divergence appeared with extremely strong buying pressure from whales, making this reversal signal more noteworthy than before.
 RSI Divergence: TradingView
If HBAR breaks above the resistance zone that previously caused a price reversal, this divergence could completely reverse the trend from bearish to bullish. This could also be the target that whales are aiming for.
The most important HBAR price milestones
The HBAR price needs to close the daily candle above $0.159 to confirm a breakout of resistance. Previously, HBAR has never broken above this area during pullbacks. If it surpasses $0.159, HBAR will break out of the wedge and have a chance to advance towards $0.198 and $0.219.
If the price weakens again, the $0.122 level is a key area to watch. If it falls below this level, the HBAR will return to the lower edge of the wedge. However, this area is quite weak as it only forms two touch points. If it breaks below this level, the recovery trend will be further delayed, indicating that sellers still control the market.
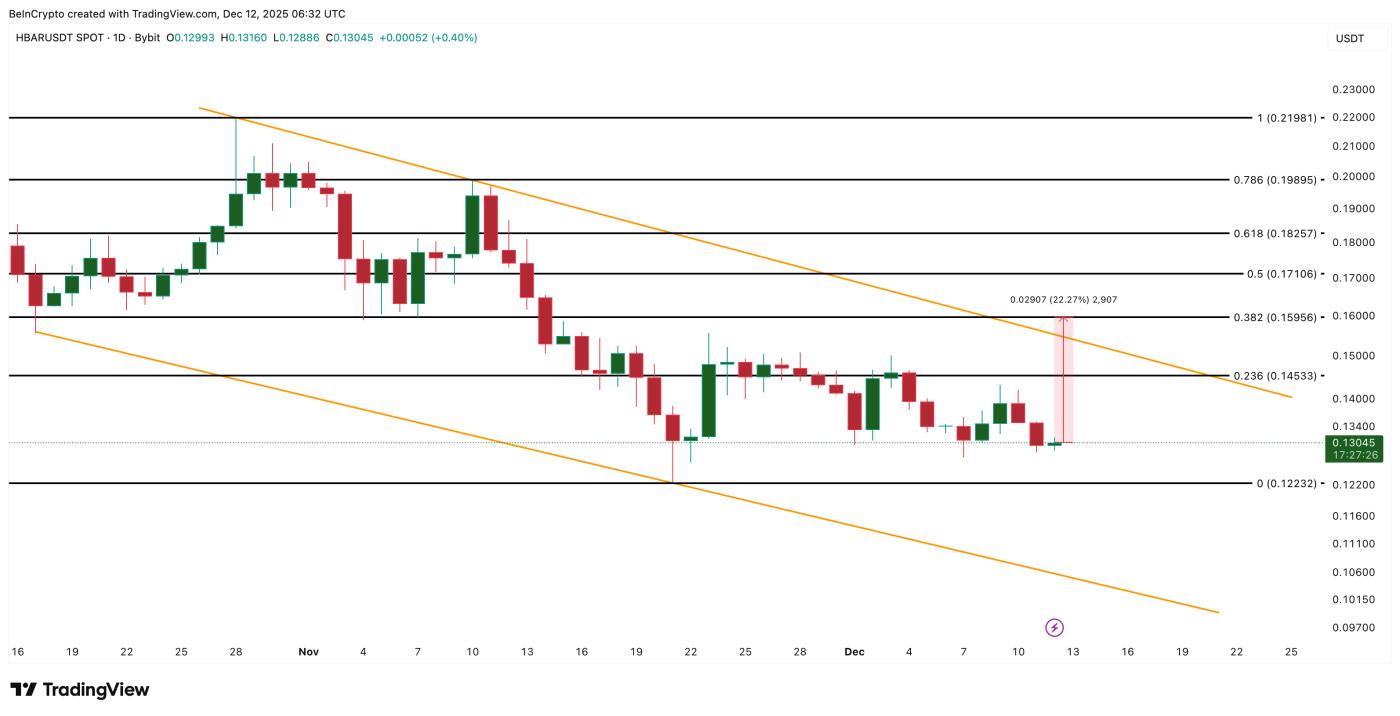 HBAR Price Analysis: TradingView
Currently, OBV indicates weak demand, RSI is giving positive signals, and whales have bought approximately 3.42 billion HBAR at the Dip. If HBAR can surpass $0.159, whale accumulation will become a major driver for a price rebound, rather than just a side signal.