Solana has had a volatile August. The Token has tried to hold above $210 several times but failed to maintain its momentum, slipping back into the range. At the time of writing, Solana is trading near $205, down 4.5% over the past 24 hours and about 1% lower over the past week. Monthly gains remain above 13%, and the yearly trend remains positive at nearly 50%.
However, September could challenge this uptrend as on chain and technical signals point to weakness.
Profitable supply near six-month high
One of the most important metrics is the percentage of supply in profit, which measures how many coins are currently worth more than their original price.
The index hit a six-month high of 96.56% on August 28, 2025 before falling slightly to around 90% today.
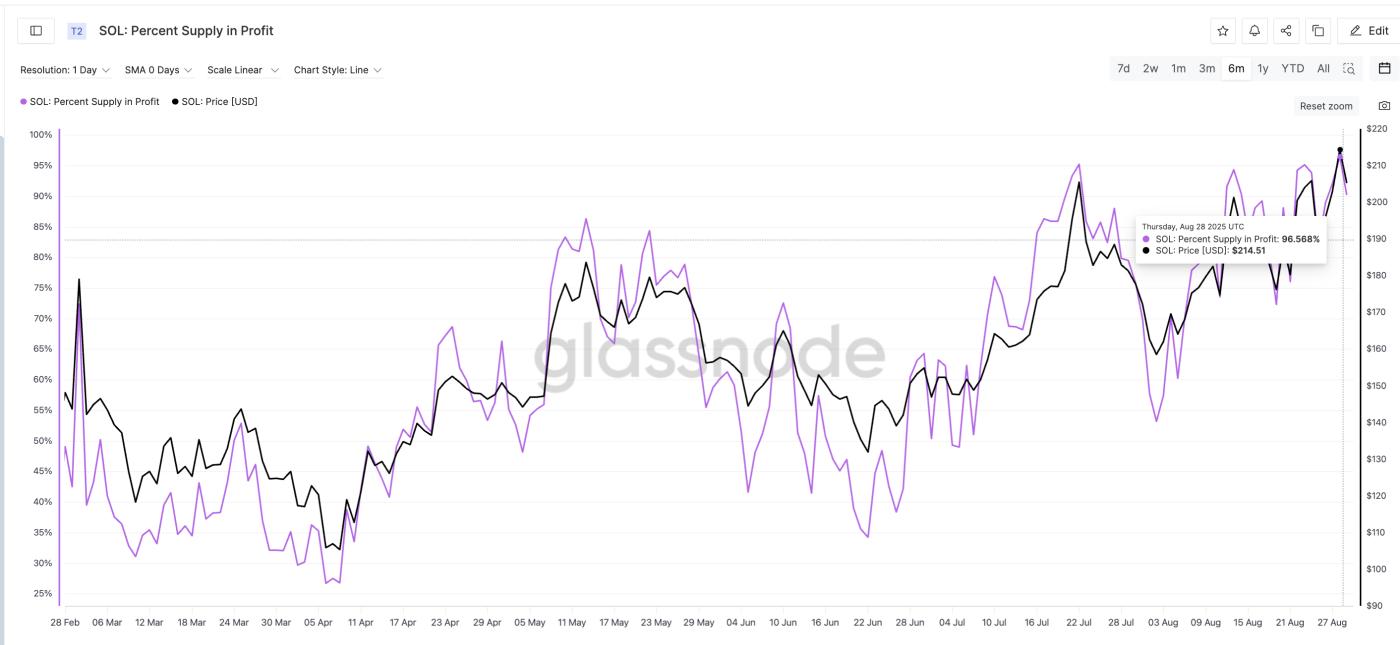 Solana Price and Profitability : Glassnode
History shows that such highs have often preceded Solana price corrections. On July 13, 2025, the index hit 96% when Solana was trading around $205, before falling 23% to $158.
Again, on August 13, 2025, the index peaked at 94.31%, triggering a 12% correction from $201 to $176. Then, on August 23, 2025, another peak at 95.13% led to an 8% decline from $204 to $187.
With the index back near record highs, the risk of a deeper correction in SOL prices in September is increasing.
To stay updated on TA and the Token market: Want more Token insights like this? Sign up for Editor Harsh Notariya's daily Crypto Newsletter here .
Exchange balance reinforces selling risk
That selling risk is reinforced by exchange balances. The number of SOL held on centralized exchanges rose to more than 32 million Token on August 28, 2025, up from less than 30 million at the beginning of the month. Rising balances typically indicate that investors are preparing to sell.
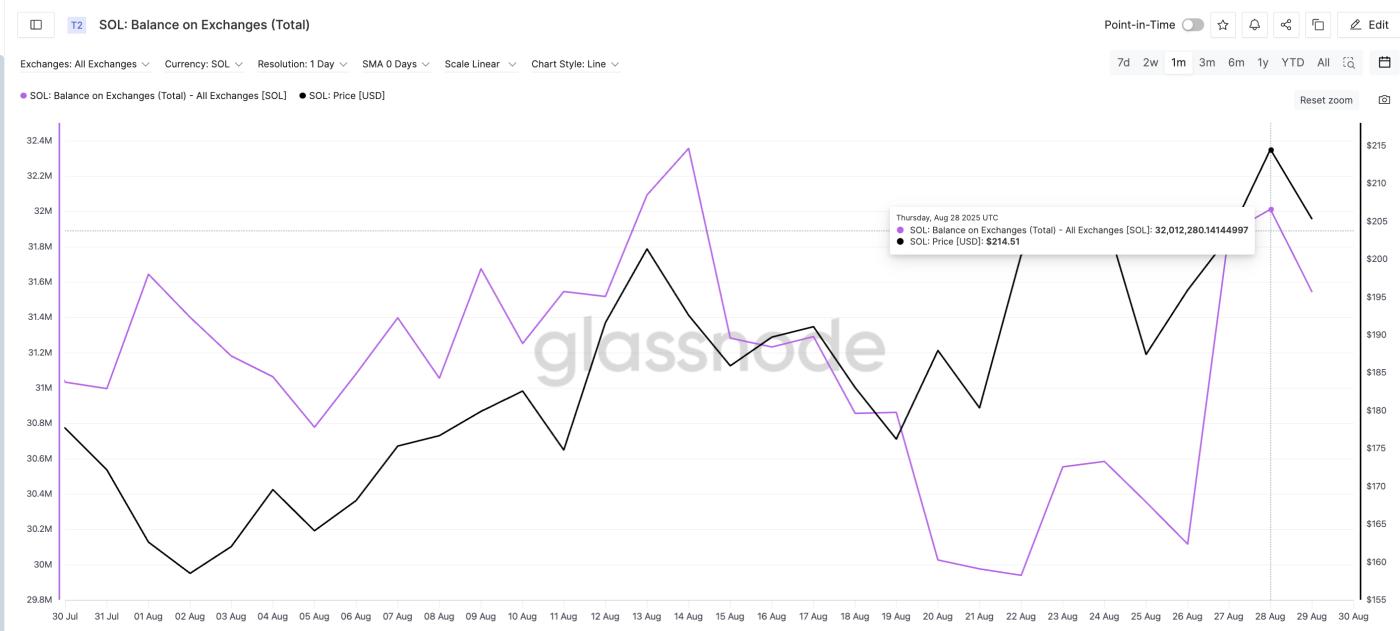 Solana Price and Balance on Exchange: Glassnode
The correlation is clear. On August 14, 2025, when the balance peaked at over 32 million, Solana price dropped 8% from $192 to $176 in a matter of days.
Now, with the balance rising again, a similar setup is forming, indicating that fresh bearish pressure could weigh on SOL prices in September .
Solana Price Pattern Suggests Bearish Setup Despite Positive History
Technical factors also support this bearish outlook. Solana is moving within a rising wedge on the weekly chart — a pattern that typically signals weakening momentum and can lead to further downside or a reversal.
If Solana loses $195 and $182, the decline could extend to $160, marking another potential 15–20% correction. Interestingly, such corrections have occurred in the past when exchange balances and the percentage of supply in profit spiked. A break below $182 would even confirm a bearish pattern breakout.
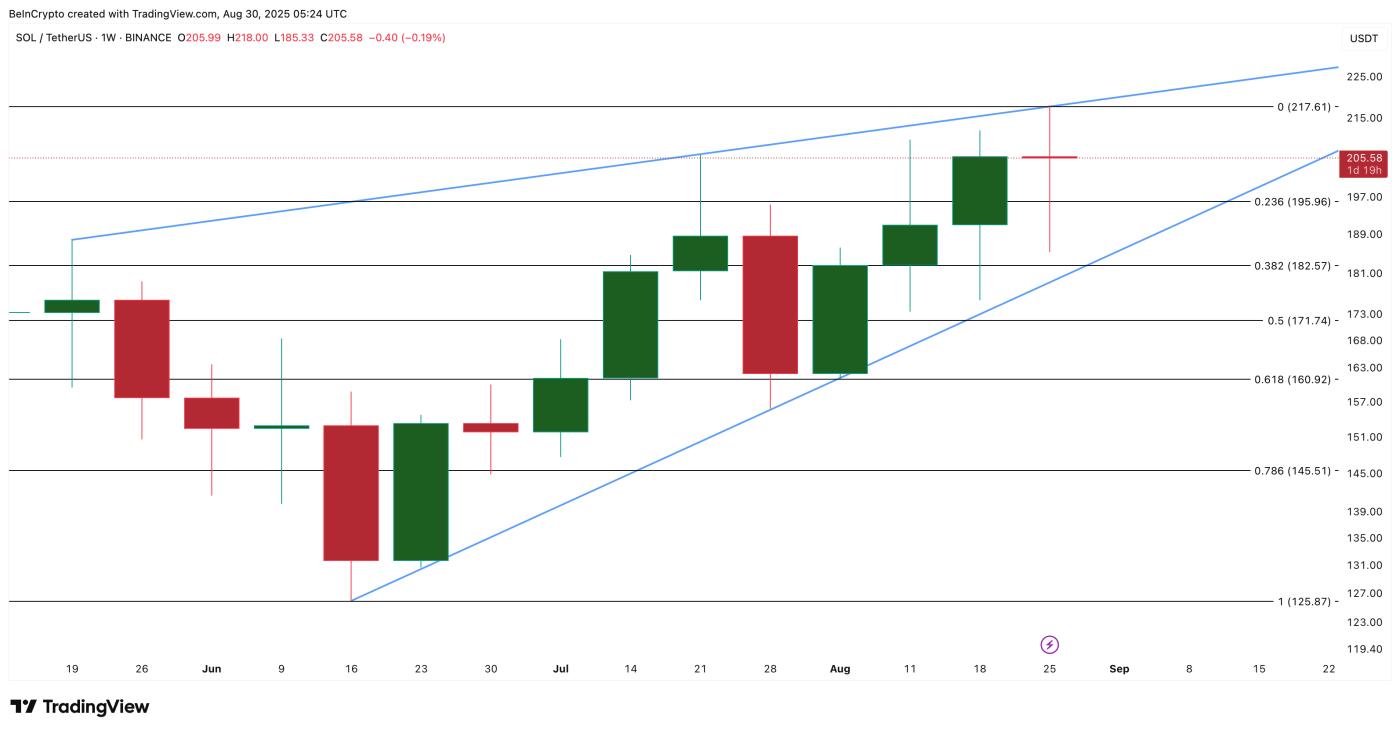 Solana Price Analysis : TradingView
However, the bulls still have a way to go to regain strength. A weekly close above $217 — the last local high — would invalidate the bearish implications of the wedge and open the way for higher targets. Until then, the bias remains bearish.
This bearish technical setup comes amid generally positive seasonality. Since 2021, Solana has delivered September returns of 29%, 5.3%, 8.2%, and 12.5%. But with high levels of profitable supply and high exchange balances, 2025 could be the year this chain breaks.
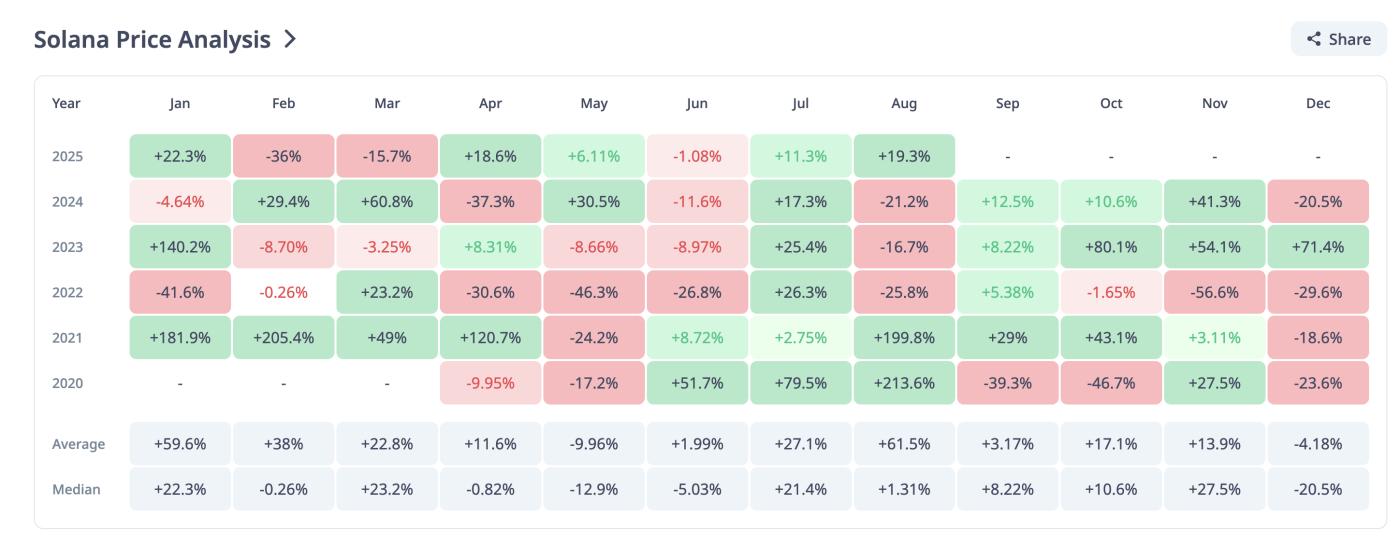 Solana Price History : Cryptorank
Unless SOL can close decisively above $217, Solana price in September could struggle, even with the positive boost from historical performance and ETF-related optimism.