In the 183rd Uweb Live Class, Afeng, a distinguished Uweb alumnus and creator of the Data Weekly, presented an in-depth presentation on on-chain data. Focusing on the Data Weekly from August 11 to 18, 2025, this livestream analyzed on-chain data for Bitcoin (BTC) and other major cryptocurrencies, delving into the sources, importance, historical analysis, and implications for future market trends. The following is a comprehensive summary of the livestream, organized into several key topics and addressing possible pronunciation or phrasing errors in the audio extraction transcript.

1. The Nature and Importance of On-Chain Data
1. What is on-chain data?
Afeng first explained the concept of on-chain data, noting that its core lies in the open and transparent nature of the Bitcoin blockchain. As a decentralized distributed ledger, Bitcoin records detailed information about every transaction, including outgoing and incoming addresses, and transaction amounts. This data is fully public, allowing anyone to access historical transaction records through a blockchain explorer. On-chain data analysis uses capital flows, profit realization, and the behavior of long- and short-term holders to gauge market sentiment and future market trends.
Unlike traditional financial markets, which rely on account balance settlement (e.g., direct increase or decrease of bank account balances), Bitcoin uses the UTXO (Unspent Transaction Output) model. A UTXO is unspent "change" held at a specific address in the Bitcoin ledger. It is essentially a voucher that records the time Bitcoin was generated and its price at the time. Afeng emphasized that the UTXO model allows on-chain data to clearly reflect the costs and behaviors of coin holders, providing a crucial basis for investment decisions.
2. The difference between on-chain data and traditional finance
Transaction data in traditional financial markets is typically not publicly available, and the account balance models of banks and brokerages struggle to provide the same transparency as Bitcoin's on-chain data. However, every Bitcoin transaction is recorded and publicly accessible on the blockchain, breaking the "dark forest law" of traditional finance and establishing a completely new asset logic. Afeng pointed out that the transparency of on-chain data enables market participants to reach consensus, thereby more effectively driving market trends.
Furthermore, on-chain data analyzes market sentiment by analyzing the behavior of long-term holders (holding for more than 155 days) and short-term holders (holding for less than 155 days). For example, long-term holders tend to hold rather than sell, while short-term holders are more inclined to speculate. By observing the capital flows and profit realization of these groups, market trends can be inferred.
II. Historical Review and Accuracy of Weekly Data Reports
1. Four-month review of weekly reports
Afeng reviewed the performance of the weekly data report since its launch in April 2025, pointing out that it has experienced multiple stages, including the main bull market wave, accumulation, wash-out, rebound, and correction. Verified by historical data, the weekly report's trend judgment is generally accurate, especially at the following key points:
- April 6 to May 11, 2025 : The on-chain divergence curve shows a small loss followed by a quick recovery, indicating that the market has bottomed out and is suitable for swing trading, but not a major uptrend.
- May 17 to July 7, 2025 : The BTC trend peaked, but because long-term holders did not sell, the decline was limited and the opportunity to build a position on the left was missed.
- July 14 to August 11, 2025 : The weekly report clearly indicates that the main upward trend has begun, but the upward space is limited, judging by the holdings of long-term and short-term holders and the unrealized profit (NUPL) indicator.
- Starting from August 11, 2025 : Last week’s weekly report indicated that BTC risks were emerging and insufficient demand led to a pullback, which was consistent with this week’s market conditions.
2. Limitations of on-chain data
While on-chain data excels at predicting broad trends, Afeng acknowledges its limitations: It cannot accurately predict ultra-short-term market conditions (such as specific declines or sideways movements). This is because on-chain data reflects long-term trends and market sentiment rather than short-term fluctuations.
3. This week's market analysis and core indicator interpretation
1. Market Review
This week, BTC experienced a correction, falling approximately 2.5% from its peak. Ethereum (ETH) fell from $4,800 to $4,300, and other major cryptocurrencies also generally experienced declines after rising. Using data from Crypto Bubble, Afeng pointed out that, with the exception of OKCoin, which saw an abnormal price increase due to token burns, most cryptocurrencies showed a correction.
2. Behavior of long-term and short-term holders
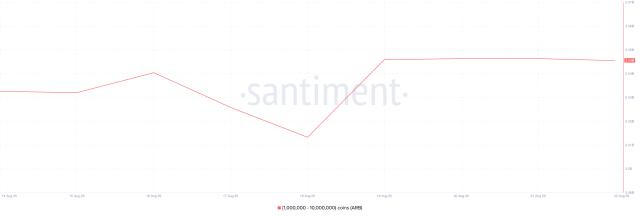
Using the "Holding Cycle Storm Chart," Afeng analyzed the behavioral changes among long-term (over 155 days) and short-term (under 155 days) holders. This week, the distribution trend among long-term holders slowed, while demand from short-term holders also weakened. Meanwhile, long-term holders with holdings of over one year (365 days) shifted from distributions to accumulation, signaling the risk of a short-term price correction.
Afeng specifically explained the reasoning behind the addition of the "One-Year+ Holders" indicator: With the entry of institutional investors, their profit logic differs from that of traditional crypto makers. By purchasing BTC in the crypto and cashing out profits in the stock market, institutions have reduced their distribution activity, leading to a decrease in the sensitivity of the 155-day indicator. The "One-Year+ Holders" indicator better reflects the guiding significance of institutional behavior on market trends.
3. UTXO Energy Band and Chip Distribution
The UTXO Energy Band is one of the core indicators in this weekly report. It reflects the distribution of chips by calculating the corresponding BTC prices of UTXOs generated at different time points. Afeng compares it to a "rock climbing" process: the current price range is the "cliff," the chip-dense area below (such as $110,000) is the "supporting rock," and the sparse area above is the "resistance branch."
This week, BTC fell below resistance and entered a new trading range, but the support level below $110,000 remains strong, making it suitable for a short-term position. Afeng emphasized that BTC's main upward trend is not over yet, as market makers have only distributed 216,000 BTC, far short of the 776,000 accumulated in the previous period, indicating that there is still room for further growth.
4. Global Momentum Radar and Market Sentiment
The Global Momentum Radar analyzes investor interest in the Americas, Europe, and Asia to determine market dominance. Afeng noted that investor sentiment in the Americas and Europe is currently low, while that in Asia is high, signaling a risk of "Asian takeover." If sentiment in the Americas improves, BTC is expected to rebound and reach new all-time highs.
5. On-chain Spread Curve and Profit Cashing
The on-chain profit margin curve reflects the profitability of UTXO transfers. This week's profit realization trend has increased, indicating that market makers are still distributing funds, but have not yet reached historical peaks (large-scale profit realization). Short-term holders lack confidence in profitability, with increasing losses and a high proportion of speculative funds. We should be wary of the risk of further pullbacks.
6. Extreme Pricing Deviations and Liquidity Pulses
The newly added "Extreme Pricing Deviation" indicator uses the average cost of short-term holders (blue line) and upper and lower standard deviations (upper and lower bands) to determine overbought and oversold ranges. Currently, BTC prices are in a healthy range, not touching the upper (overbought) or lower (oversold) bands. However, if they fall below the cost line (zero), a significant correction could occur.
The “Liquidity Pulse Chart” shows that the issuance of stablecoins and the inflow into exchanges have rebounded, reflecting a mild improvement in market demand for BTC, but spot trading volume remains lukewarm, indicating that the peak signal has not yet appeared.
4. Off-chain Data and Macroeconomic Expectations
1. Funding Rate Heatmap
Funding rate heat maps reflect the popularity of leveraged trading. Currently, BTC and Ethereum funding rates are relatively low, with no signs of overheating, indicating that there is still room for a major uptrend.
2. Bitcoin Spot ETF
ETFs saw net inflows of $550 million this week, an improvement from last week's over $100 million, signaling a rebound in investor interest in the US. ETFs have become the primary channel for investing in Bitcoin in the US due to their low fees and tax-avoidance advantages, and inflows are a key indicator of demand.
3. Expectations of a Fed rate cut
The market expects a 77% probability of a September interest rate cut, which will have a positive impact on Bitcoin, US stocks, and even global stock markets. The expectation of a rate cut will boost short-term demand and support Bitcoin prices.
5. Question and Answer Session and Frequently Asked Questions
During the Q&A session, Afeng responded to several key questions from the audience:
- Misunderstanding of the on-chain profit margin curve : Viewers mistakenly believed that all holders should be 100% profitable at all-time highs. Afeng clarified that the curve reflects the average profit level, not the number of profitable holders. At historical peaks, the average profit was approximately 70%-75%.
- Is exchange data included in on-chain statistics ? The exchange’s BTC reserves are on-chain, but user account balances are not directly recorded as on-chain transfers. UTXO is only generated when withdrawing coins.
- Differences between American and Asian investors : American investors dominate BTC pricing, while Asian investors often play the role of "taking over". Sentiment differences are an important basis for judging trends.
- Ethereum price prediction : Because Ethereum uses an account model rather than a UTXO model, on-chain data analysis is more difficult, making it difficult to accurately predict its peak.
VI. Summary and Outlook
Afeng concluded that BTC is currently in the middle of a major uptrend, with long-term holders' dividends yet to be distributed and market makers holding a large amount of unsold shares. The support level ($110,000) is strong, suggesting a strong possibility of a short-term upward correction. If investor sentiment in the Americas improves, BTC is expected to reach new highs, with the top expected to be around $150,000 (NUPL reaches 75%). However, caution is warranted regarding the risk of Asian takeovers and further pullbacks caused by a lack of confidence among short-term holders.
Afeng emphasized that the weekly data report is intended to provide academic discussion and does not constitute investment advice. Investors should build an independent judgment system based on on-chain data, macroeconomic policies, and market sentiment.