Bulls are losing the initiative at the beginning of the weekend, according to CoinStats.
SHIB/USD
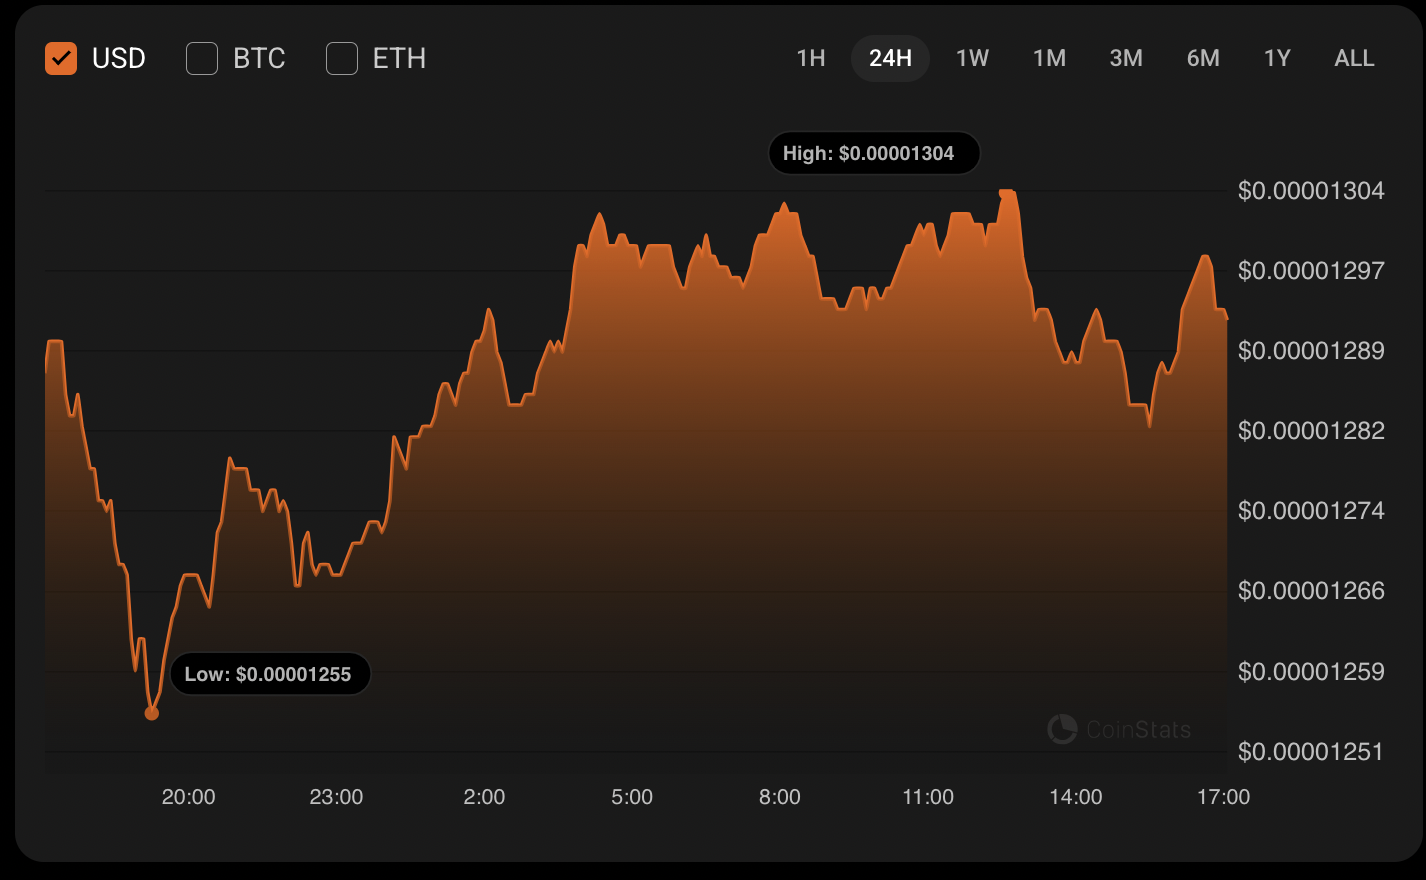
The price of SHIB has risen by 0.12% over the last day.
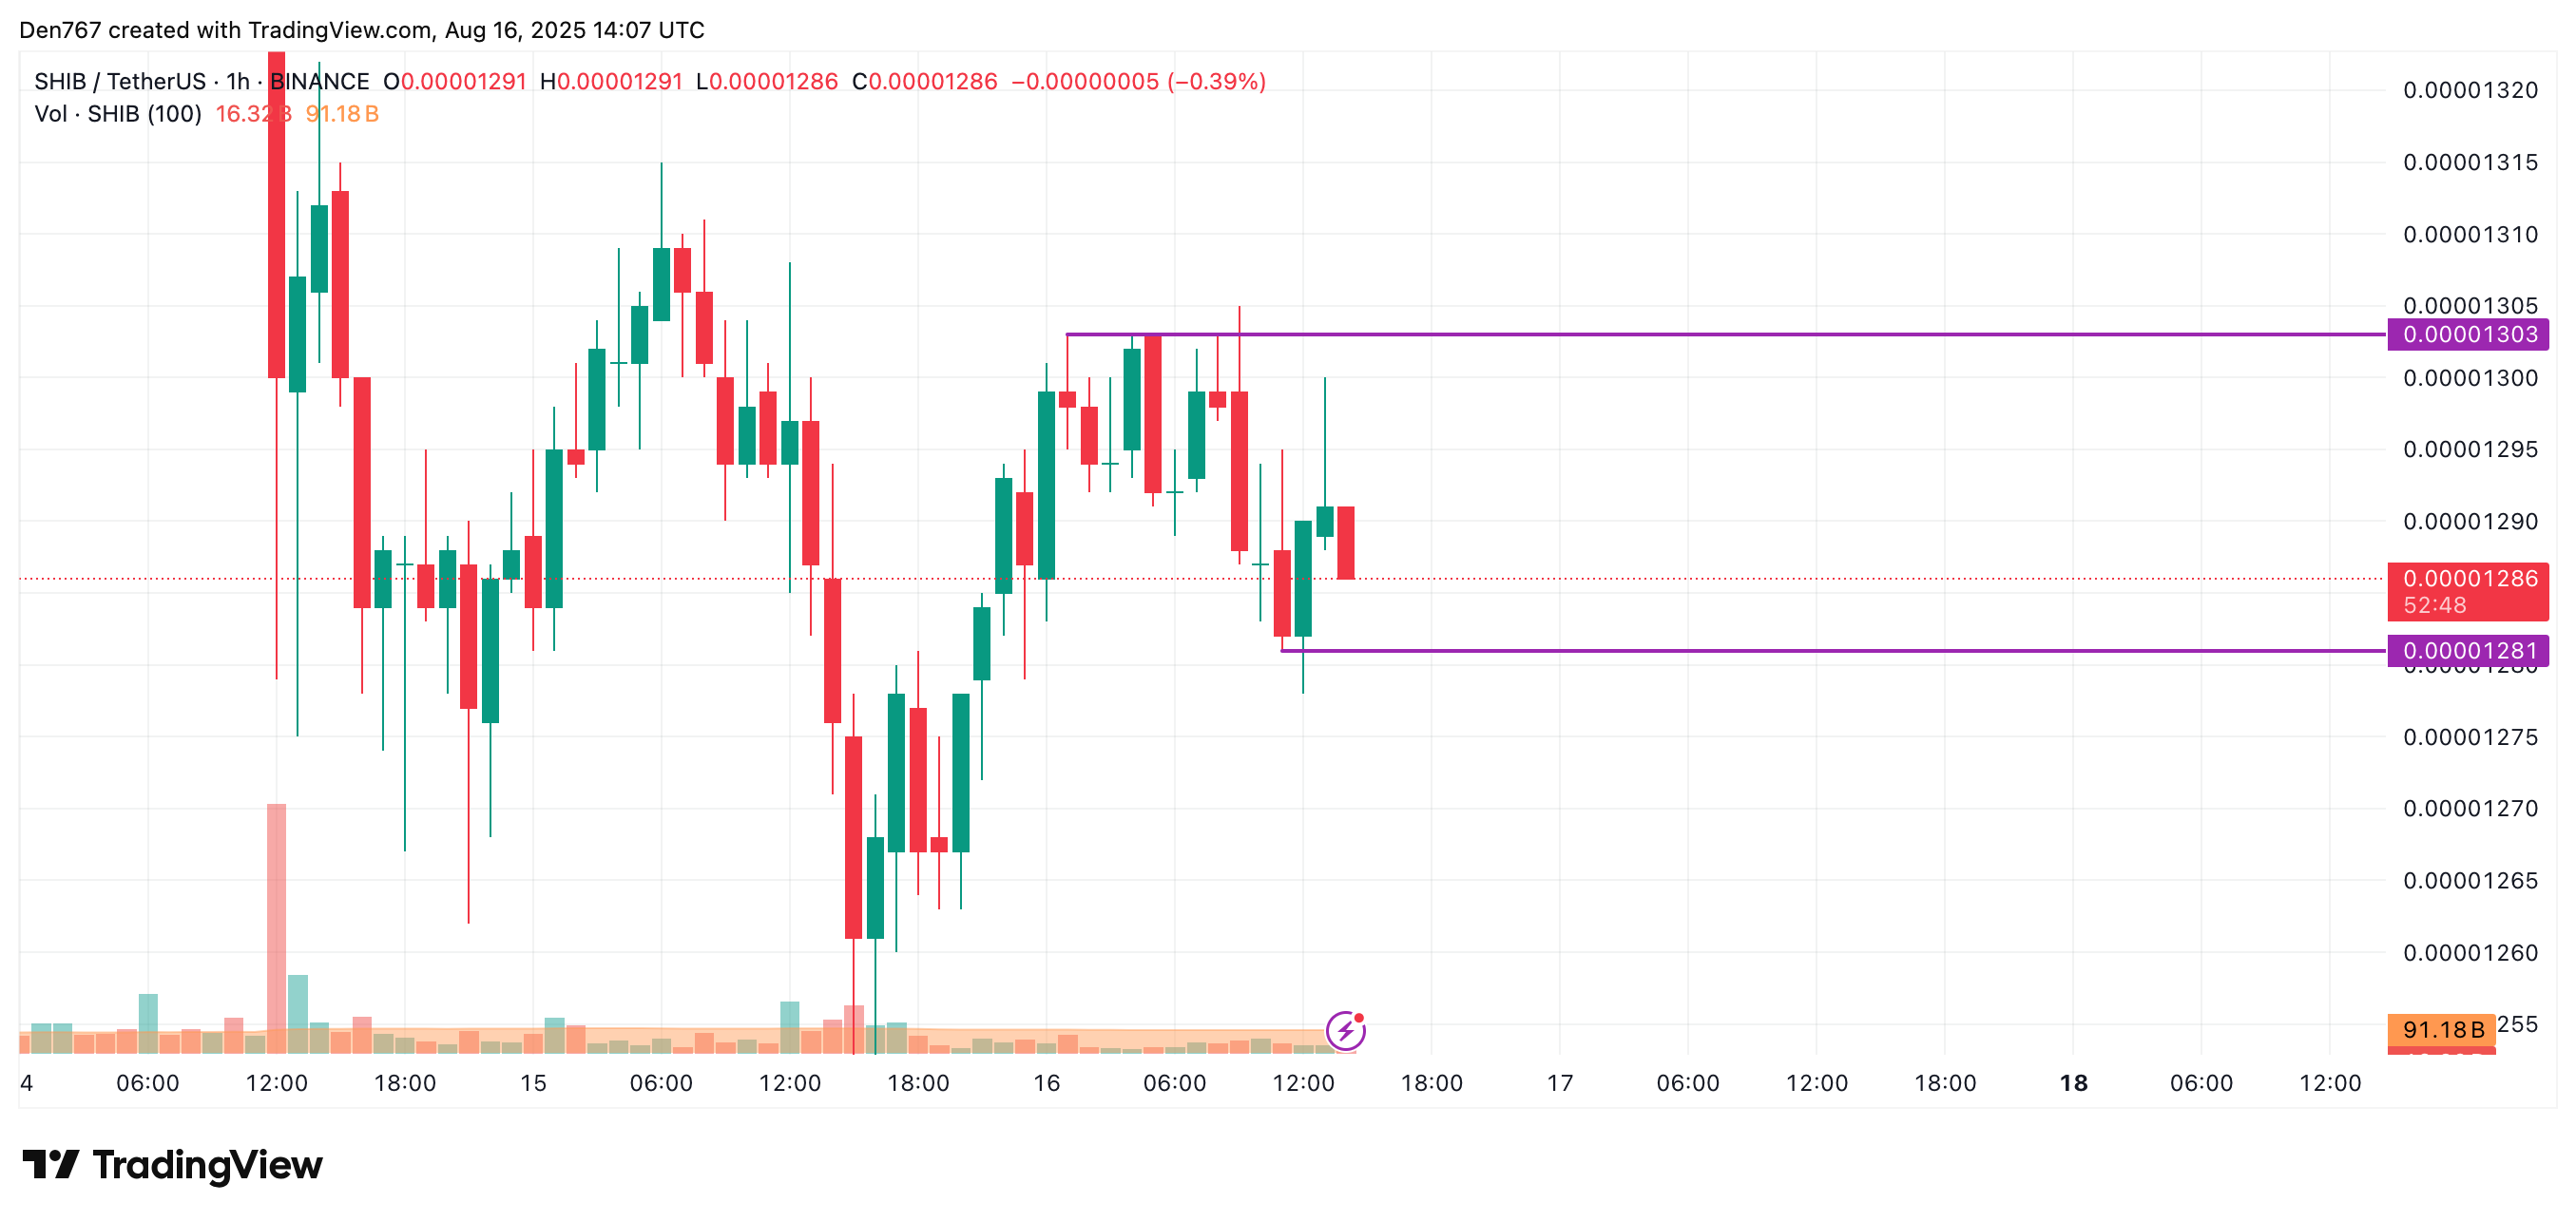
On the hourly chart, the picture is bearish as the rate is falling after a false breakout of the local resistance of $0.00001303. If sellers' pressure continues, one can expect a dump to the $0.00001270 area.
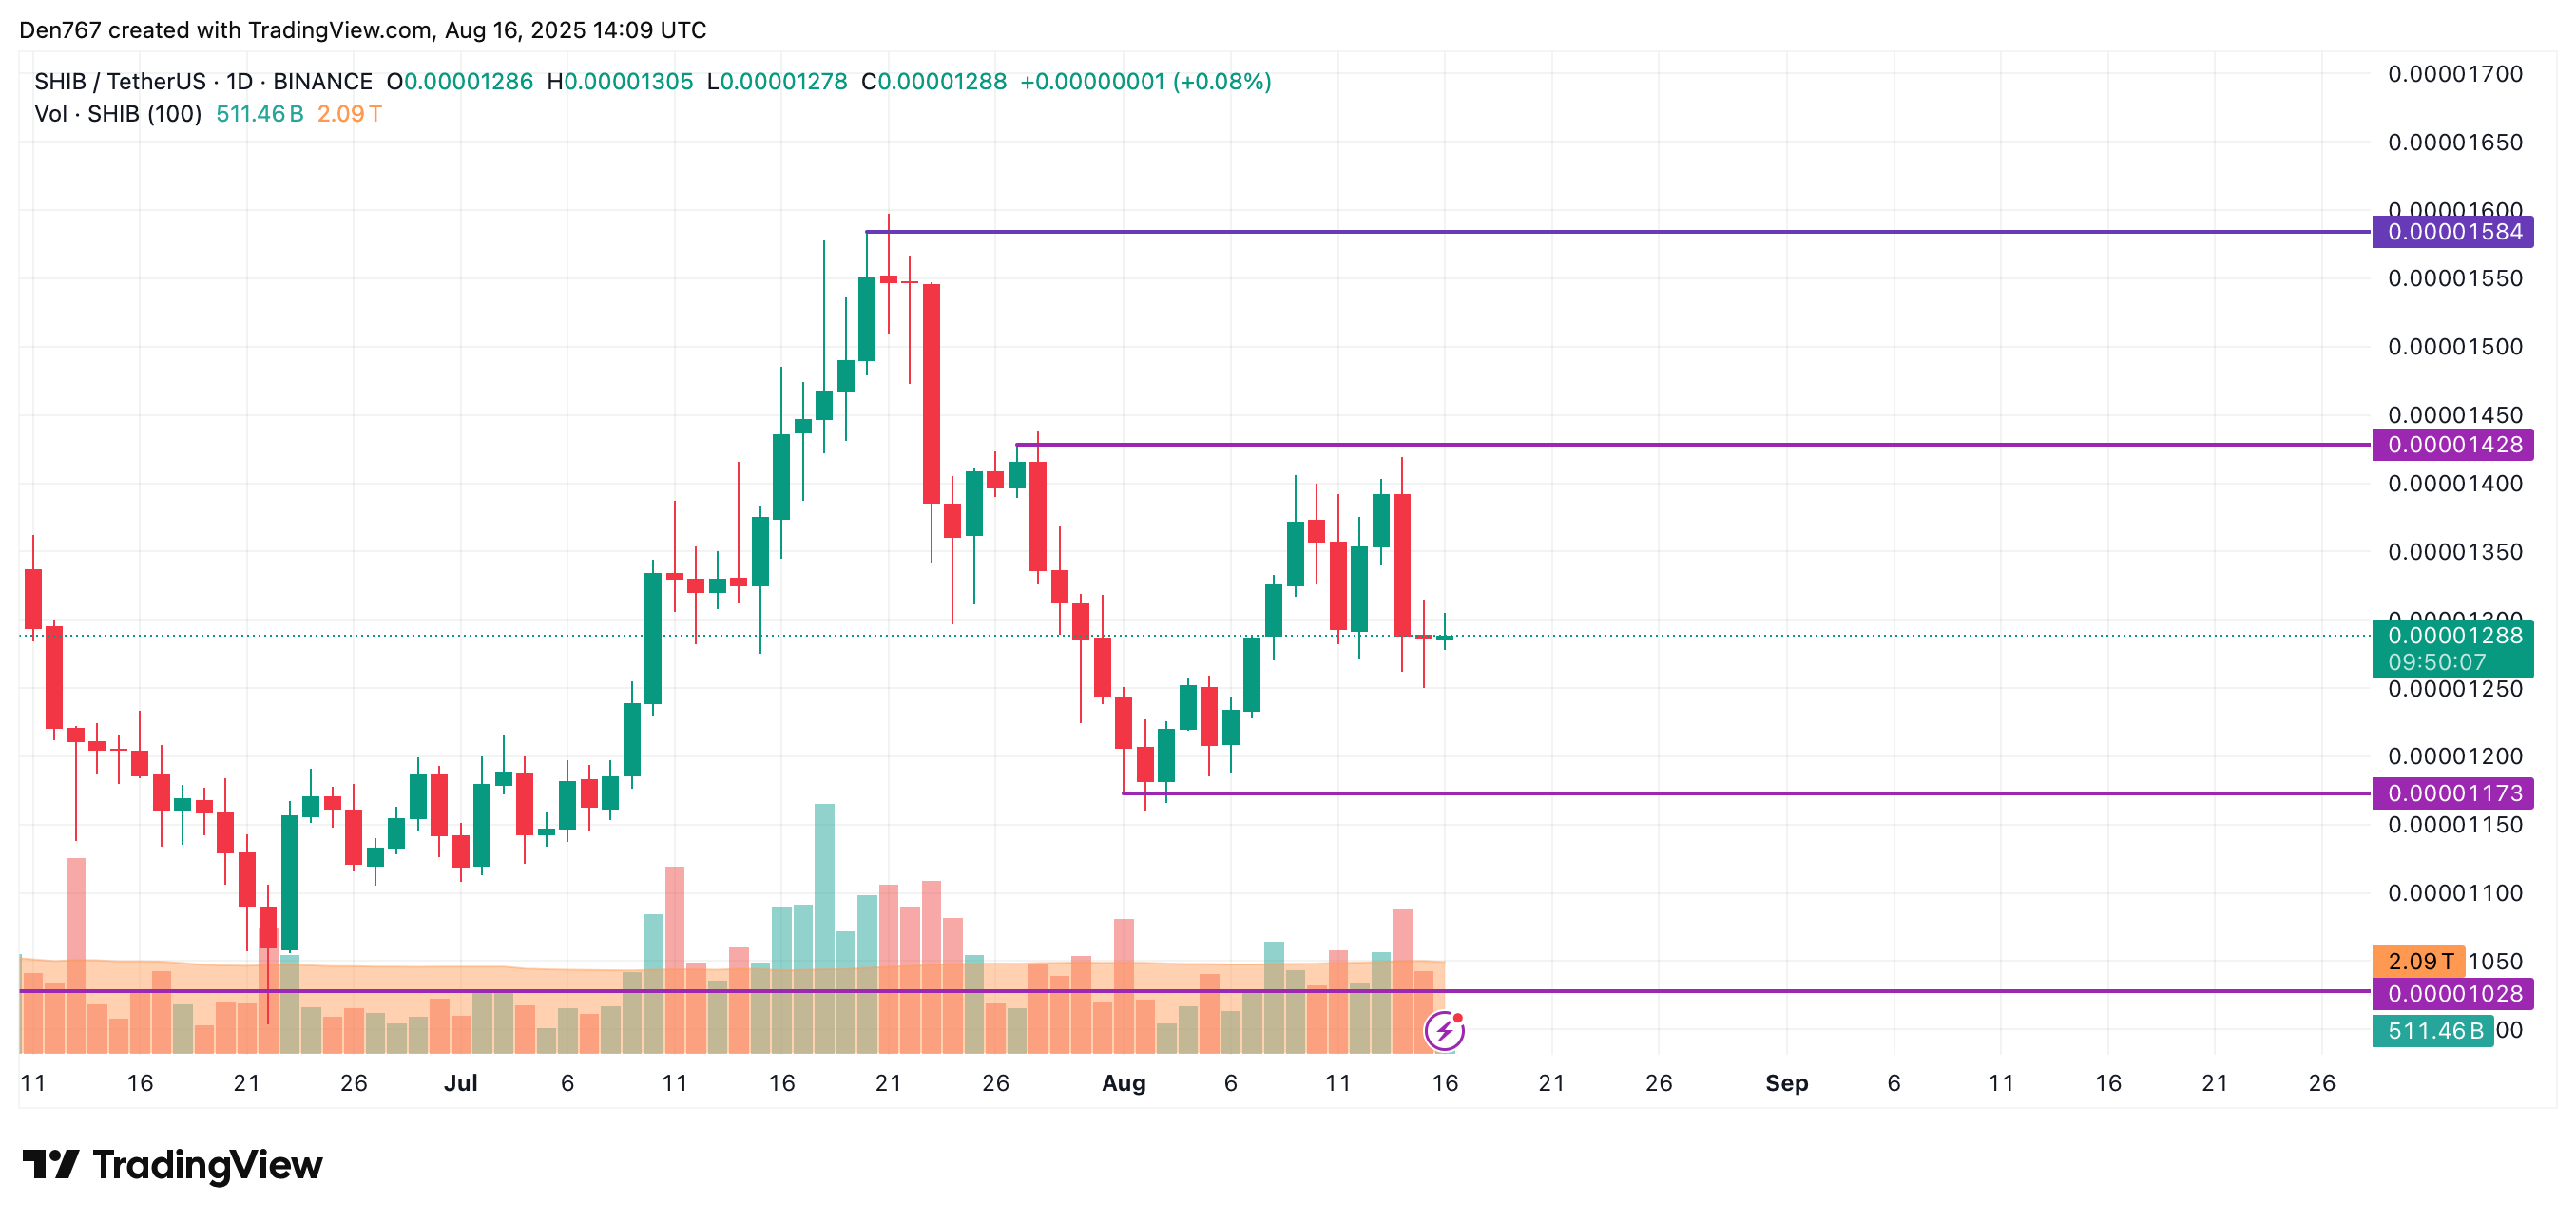
On the bigger time frame, the picture is neither bullish nor bearish. The rate of SHIB is in the middle of the wide channel between the support of $0.00001173 and the resistance of $0.00001428.
As neither side is dominating, ongoing sideways trading is the more likely scenario.
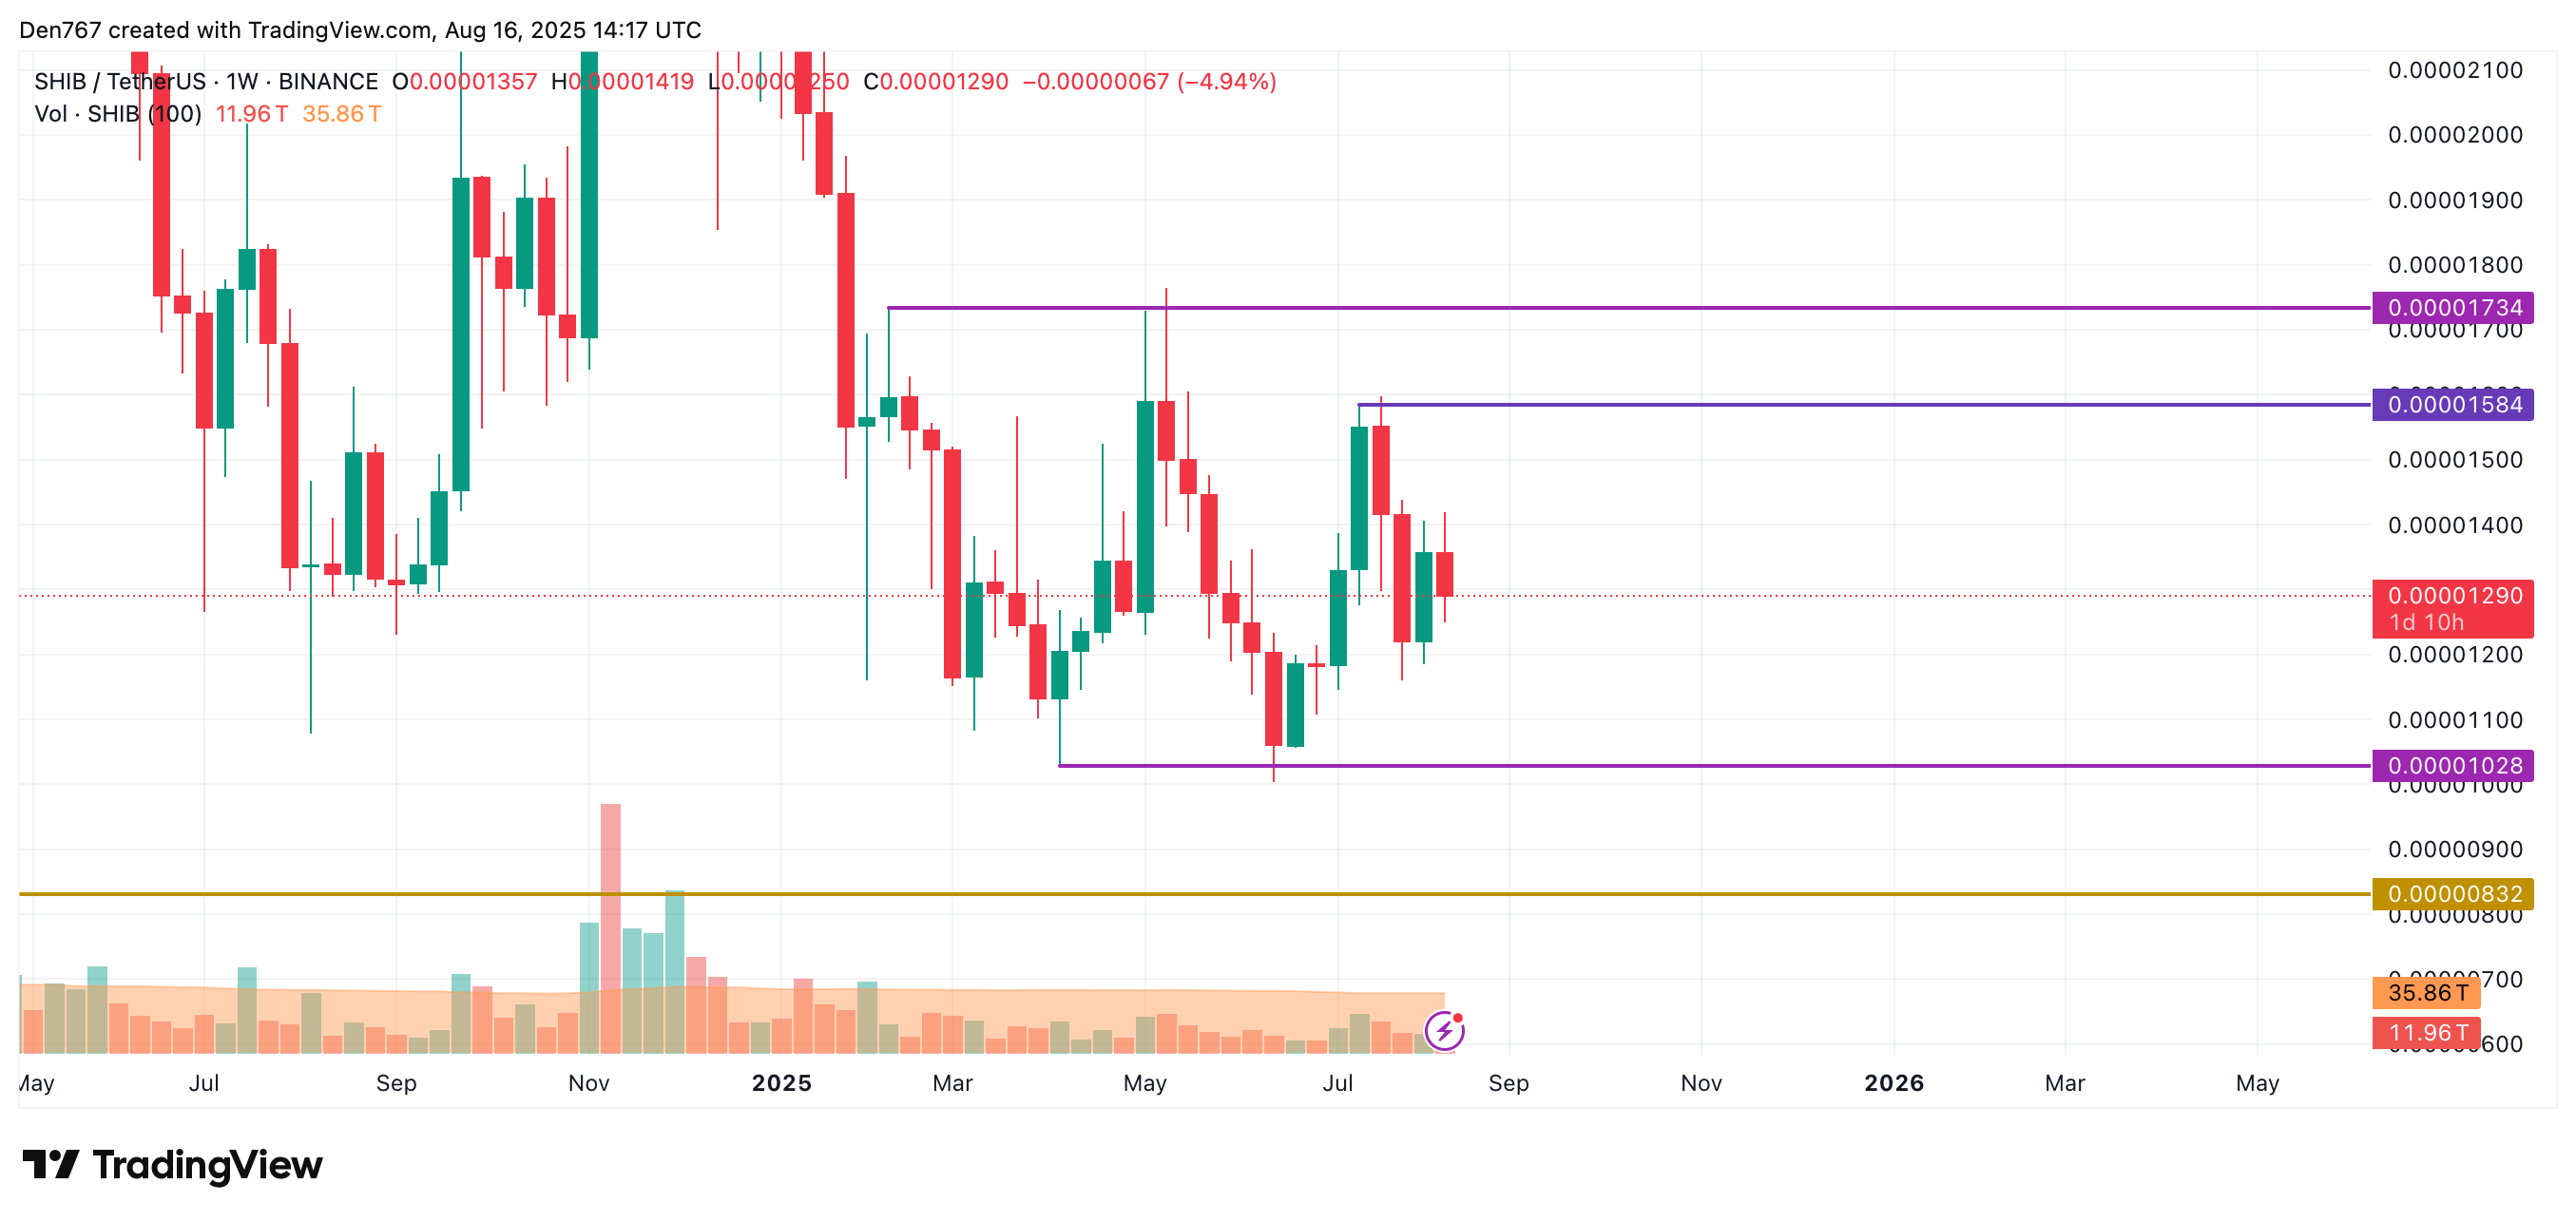
From the midterm point of view, the situation is similar. The volume is falling, which means traders are unlikely to see sharp moves by the end of the month.
SHIB is trading at $0.00001290 at press time.