XRP has not surged strongly, but is fluctuating near the $3 mark, maintaining a 35% increase this month. However, last week erased over 5.3% of that gain. This makes traders uncertain whether a breakout is imminent or another price drop is approaching.
And with August typically being volatile for XRP, the price is at a critical point where everything depends on how traders and whales behave near the $3.00 level.
Exchange Flows and Liquidation Map Suggest Short Squeeze Setup
One of the main reasons XRP has not seen a strong rally is increased selling pressure on exchanges. Net inflows have started to rise again, especially after July 30, 2025, when the price approached the $3.00 mark.
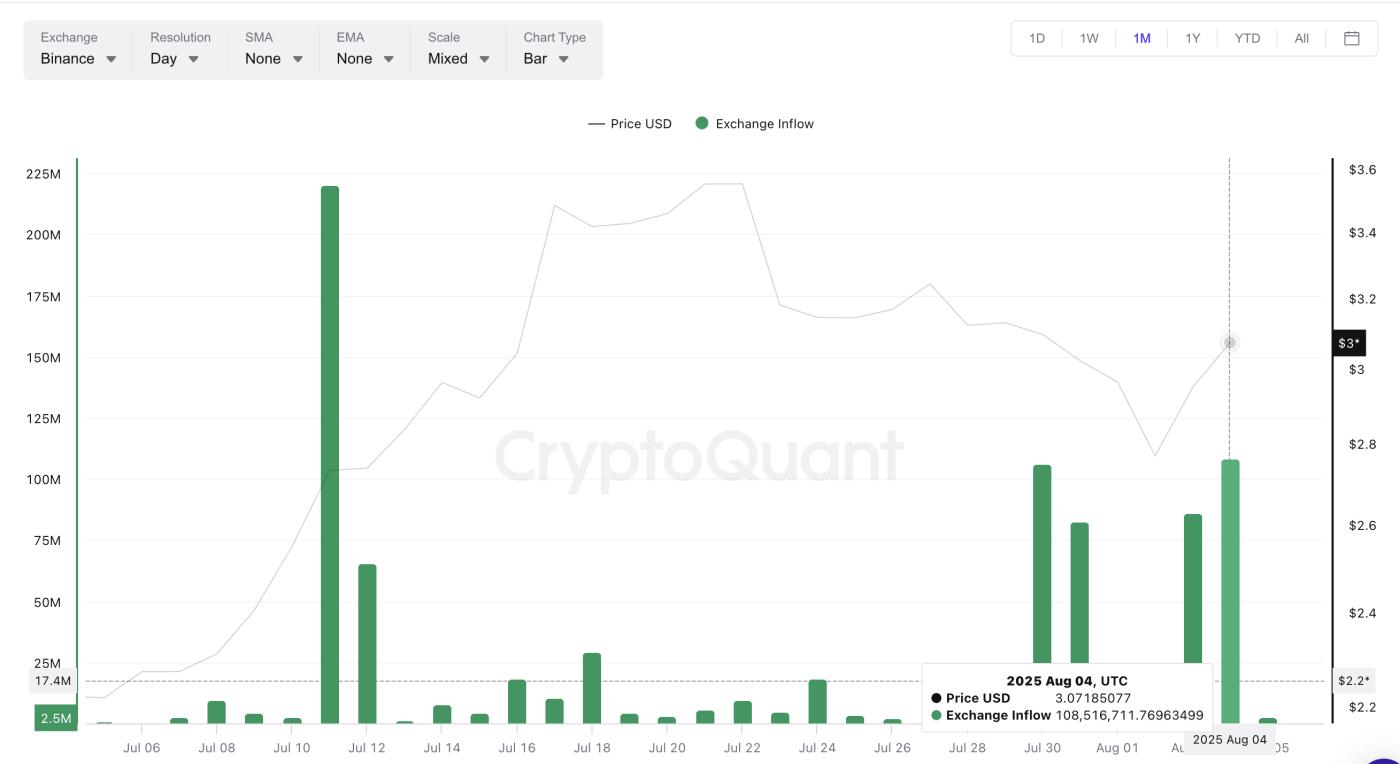 XRP Price and Exchange Inflows: Cryptoquant
A similar movement was seen on July 11, 2025, when exchange inflows spiked to over 220 million XRP. At that time, the price did not immediately correct. Instead, it surpassed $3.60, and only afterward did selling catch up. This suggests traders were positioned to exit near the peak, holding funds on the exchange without selling immediately.
Moving to the present: inflows are rising again, suggesting traders may be preparing to sell if XRP breaks above $3.00. But despite this bearish setup, the liquidation map tells a different story. It may indicate when selling will actually begin.
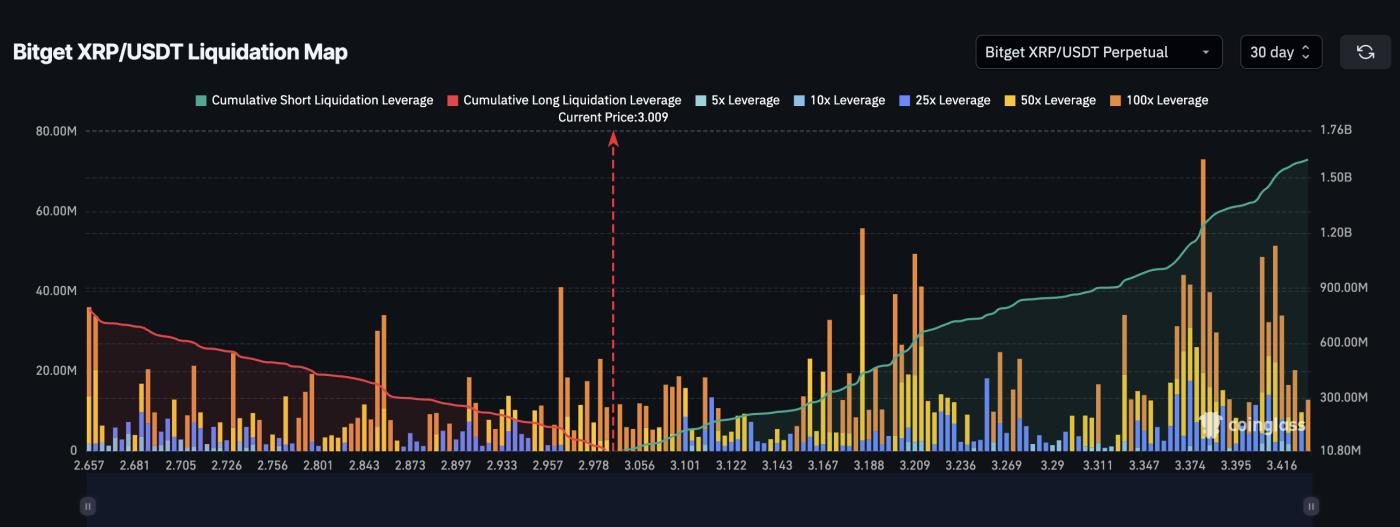 XRP Liquidation Map: Coinglass
XRP liquidation data from Bitget shows the market is still heavily skewed towards short selling. Short positions reach up to $1.6 billion, while long positions only reach $784 million. This imbalance means a sudden upward movement could liquidate a large number of short positions, creating a classic short squeeze. With the current price fluctuating near $3.00, a 10% to 14% move could trigger a short squeeze up to $3.40.
Note: A similar event occurred from July 24, 2025, to July 27, 2025, when XRP's price rose from $2.95 to over $3.30 without any clear reason. Although this raised suspicions of price manipulation, the possibility of a similar occurrence cannot be ruled out.
For TA and token updates: Want more detailed information about such tokens? Subscribe to the Daily Crypto Newsletter by Editor Harsh Notariya here.
Are Whales Driving the Movement or Staying Out?
Interestingly, whales may also play a role in driving this movement. Data from whale-to-exchange flows shows large investors have sold heavily during previous price increases. On July 30, 2025, whale flows spiked to over 55,000 XRP, the highest in a month, when XRP price dropped below $3.00. Again, on August 3, 2025, flows reached 38,226 XRP as the price approached the $3.00 mark.
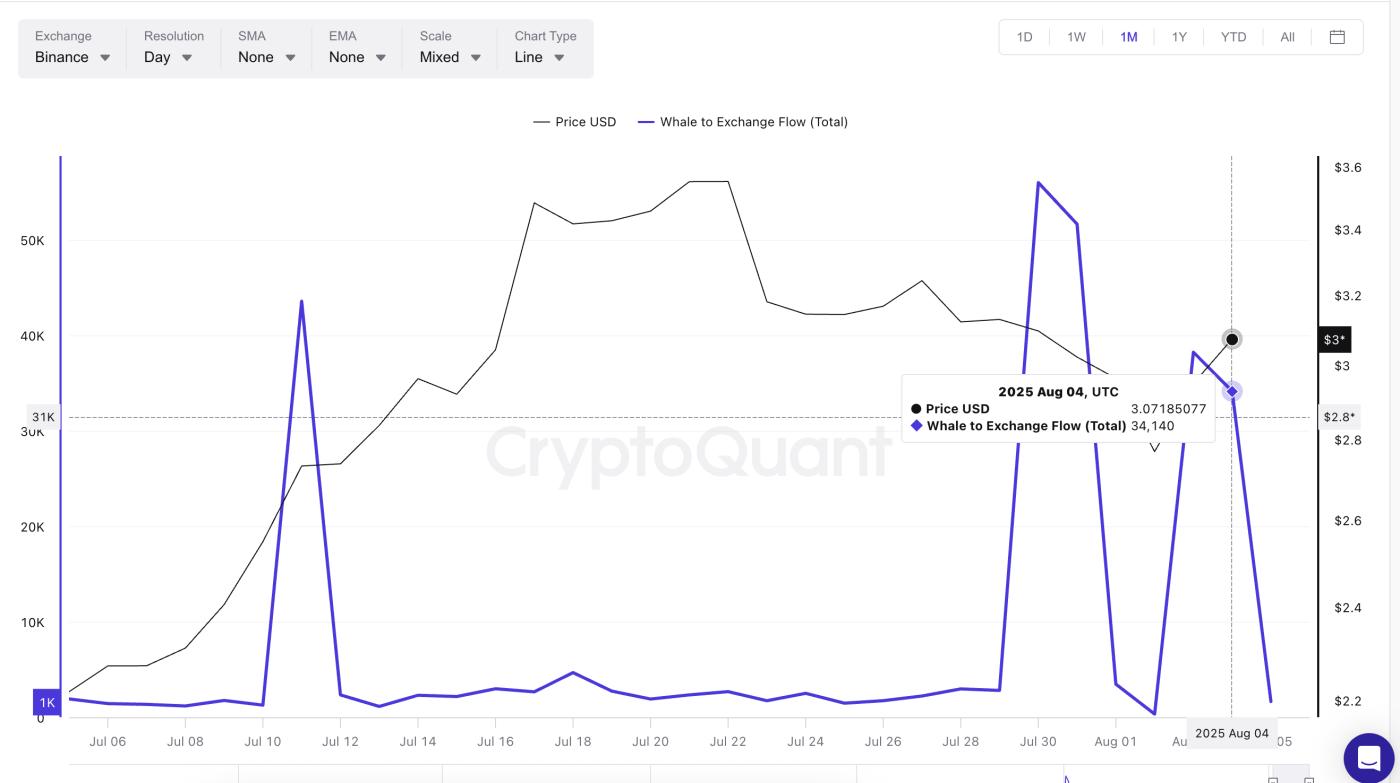 XRP Price and Whale-to-Exchange Flows: Cryptoquant
But since then, flows have dropped to 34,140 XRP on August 4, 2025, even as XRP price remains above $3.00. This shows a divergence: while the price increases, whales are sending fewer tokens to exchanges. This could mean they are watching carefully. Or it could mean whale selling pressure has finally diminished. Whichever signal it is, this seems positive for XRP price in the short term.
However, if whale flows increase again near the $3.08–$3.30 range, it could create enough selling pressure to prevent the "short squeeze". Traders should closely monitor whale behavior before expecting any sustained price increase.
Whale-to-exchange flows track the number of tokens large investors (whales) are sending to centralized exchanges; high numbers usually signal selling intent, while low flows may mean whales are holding.
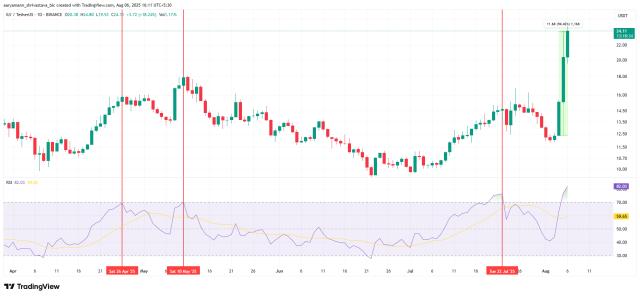
XRP Price Pattern Indicates Important Breakout Zone at $3.30
XRP's current price structure is within a descending expanding wedge pattern, a chart pattern often seen before significant price breakouts. This pattern is defined by two downward-sloping trend lines, with price moving between them. XRP is now approaching the upper trend line of this wedge, and a breakout above $3.19 would place it above the challenge of the $3.30 mark.
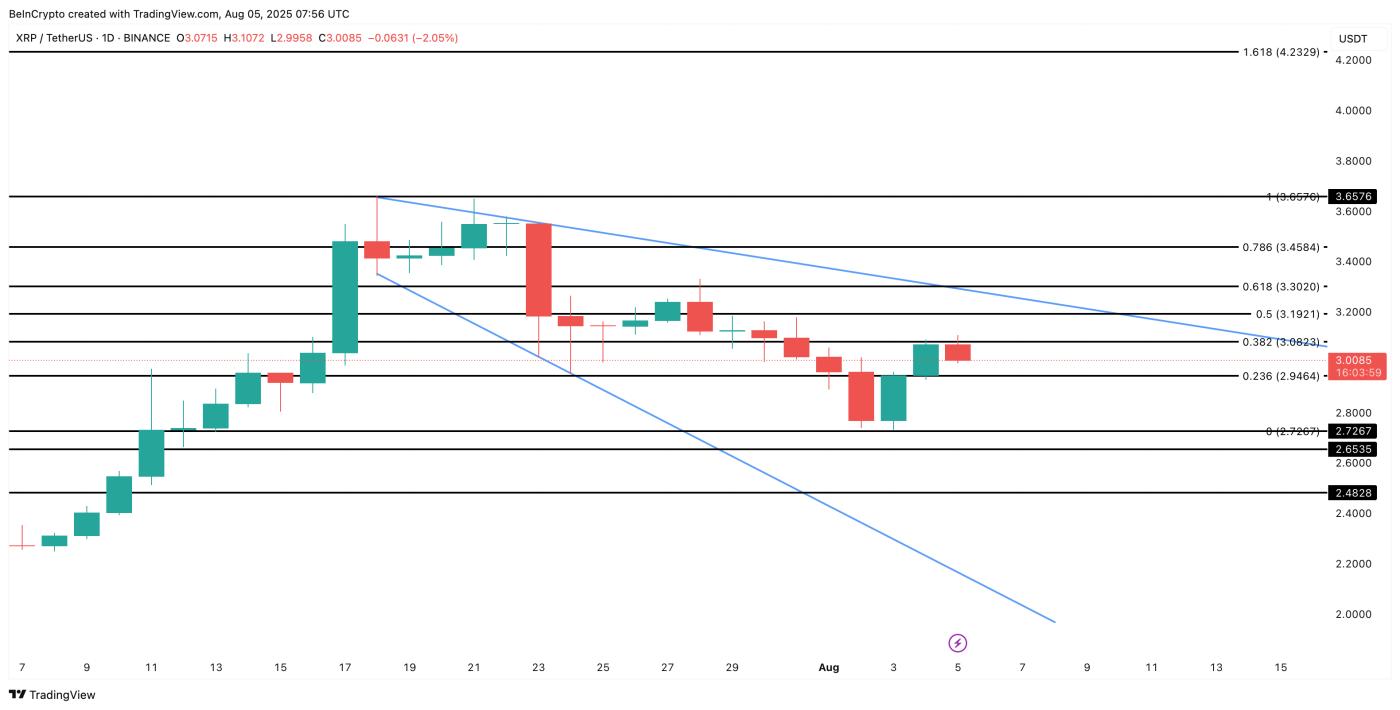 XRP Price Analysis: TradingView
The $3.30 level is not just a round number. It coincides with an important Fibonacci retracement and aligns with most of the liquidation cluster. If XRP breaks through this level, it could trigger a liquidation wave, paving the way for a more powerful breakout. Until then, movements between $3 and $3.30 should be viewed as part of a potential short squeeze, not a complete price rally.
A price rally could occur if XRP surpasses $3.45, an important Fibonacci target. At this price, all short positions on the Bitget chart would be liquidated. Until then, the short squeeze story remains valid.
However, if it fails to hold above $3 and breaks below $2.72, the price increase structure will be invalidated, potentially leading to larger losses.