Who is actively selling? (Ten-year agreement, Part 51)

This article is machine translated
Show original
At the beginning of August, the crypto market generally pulled back, with BTC continuously declining. After reaching a historical high of 123k on July 14th, BTC has been oscillating around 118k for over half a month. After experiencing two major sell-offs on July 15th and July 25th, the third sell-off on August 1st finally failed to bounce back to the oscillation range like the previous two times, instead deeply impacted, breaking through the 30-day moving average of 115.5k and sharply retracing to around 113k.
From the perspective of the 30-week moving average (approximately 200 days), is this wave of rally starting from 74.5k in early April coming to an end?
Standing at the mountain peak, looking back at the current bull market that started in January 2023, it has completed 3 main waves: The first wave from January 2023 to September 2023, from around 16k to near 30k, reaching over 30k; the second wave from October 2023 to August 2024, from near 30k to around 60k, reaching over 70k; the third wave from September 2024 to March 2025, from around 60k to over 80k, reaching near 110k.
The current wave starting from April 2025 is the 4th wave. From the Wyckoff perspective, the 123k historical high seems to be the climax of this wave.
Now, the early whale who sold 80,000 BTC between July 16-25, 2025, mentioned in the article, appears to have escaped a perfect top. Could it even be said that the creation of this top is due to their actions?
After all, this market is like a besieged city. Those inside want to get out, while those outside want to get in. But ultimately, they need to draw a big green candle first, luring the thousands of troops outside to cross the narrow bridge, allowing the whales inside to smoothly sell and exit gracefully.
The subsequent automatic rebound on the 26th made institutional analysts and KOLs marvel, praising the market's resilience.
Who would dare say how many of these voices are intentional smoke screens, meant to confuse high-position bagholders and trap them in a false sense of security?
Until the third time the market was completely crushed, analysts were still arguing about who was actively selling.
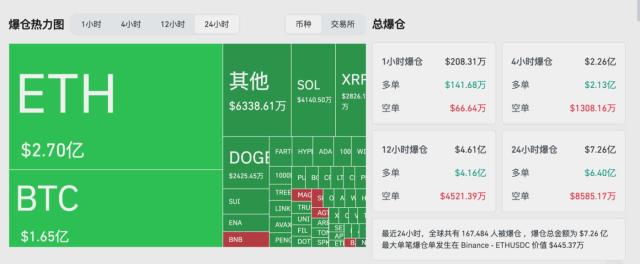
For example, Cryptoquant's analyst Amr Taha posted after the sell-off, noting that a large number of retail investors were depositing coins into Binance. He suggested retail investors were selling and pointed out that short-term holders (STH) were dramatically increasing deposit volumes, from a 7-day average of 10,000 BTC to 36,000 BTC by the end of July. He also mentioned that whales were actively accumulating ETH.
According to Glassnode's on-chain data disclosed on August 1st, the main sellers in the 24 hours were short-term holders (STH), selling $18.24 billion (85.5%), while long-term holders (LTH) only sold $3.1 billion (14.5%).
Cryptoquant's official account pointed out that they just witnessed the third wave of massive profit-taking in this bull market. Profit realization in late July suddenly increased to $6-8 billion, matching the previous two peaks in March and December 2024. The main sellers were newly positioned whales who cashed out above $120,000.
On-chain data monitoring may have loopholes. Old whales could secretly transfer coins to trading addresses, with these addresses becoming new whales and selling openly. Who would you say is actually selling?
Typically, smoke screens show market resilience when large chip transfers occur, which might be deliberate market manipulation. When the market starts cascading, you're met with deafening silence.
This weakness was accompanied by macro divergence, seemingly hinting at different dangers. Poor non-farm data increased Fed rate cut probabilities, but BTC, usually considered a risk asset, declined instead of rising with rate cut expectations, creating a macro divergence. Trump's post alleging human manipulation of non-farm data added more mystery to this anomaly.
The "Ten-Year Covenant" live tracking plan continues. This is the 51st note. July closed without gains. The plan has been executed for 26 months, with a return rate of around 110% (accounting for about 107%, equivalent to a CAGR of about 40%).
A 40% CAGR aligns with the expected compound growth rate for BTC at this stage.
Witnessing the power of time.
Sector:

Source
Disclaimer: The content above is only the author's opinion which does not represent any position of Followin, and is not intended as, and shall not be understood or construed as, investment advice from Followin.
Like
Add to Favorites
Comments
Share
Relevant content