Saturday is mainly dominated by sellers, according to CoinStats.
BTC/USD
The price of Bitcoin (BTC) has declined by 1.43% over the last day.
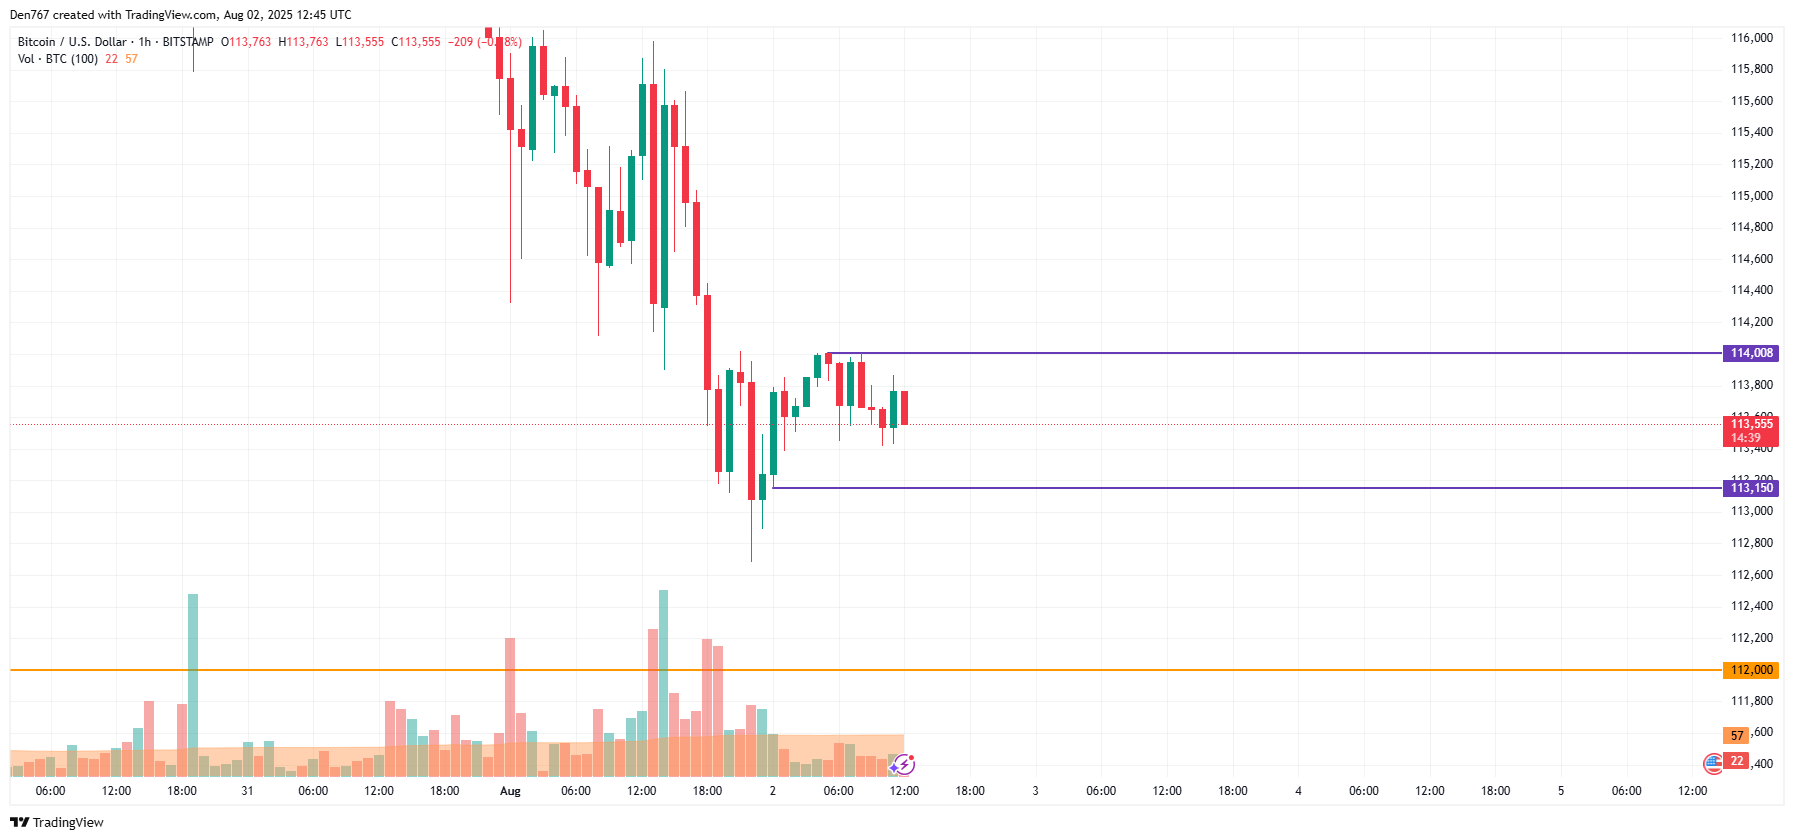
On the hourly chart, the rate of BTC is going down after a false breakout of the local resistance of $114,008. If the daily bar closes far from that mark, there is a high chance of a test of the support by the end of the day.
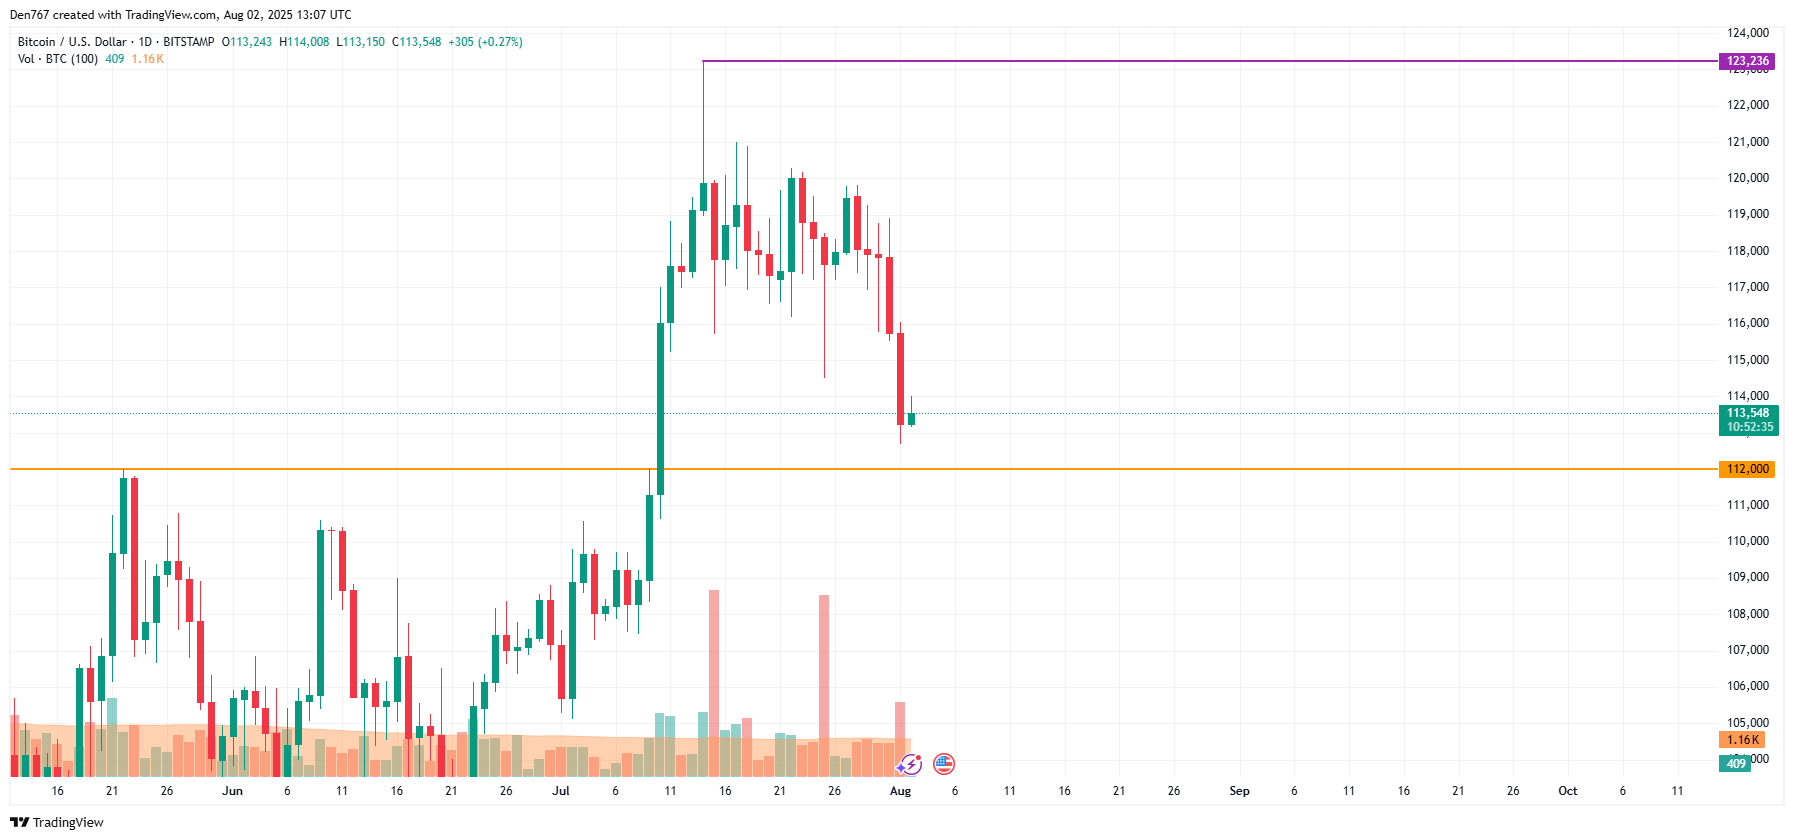
On the bigger time frame, the price of the main crypto is within yesterday's candle.
If the bar closes below $113,000, traders may witness a test of support over the next few days.
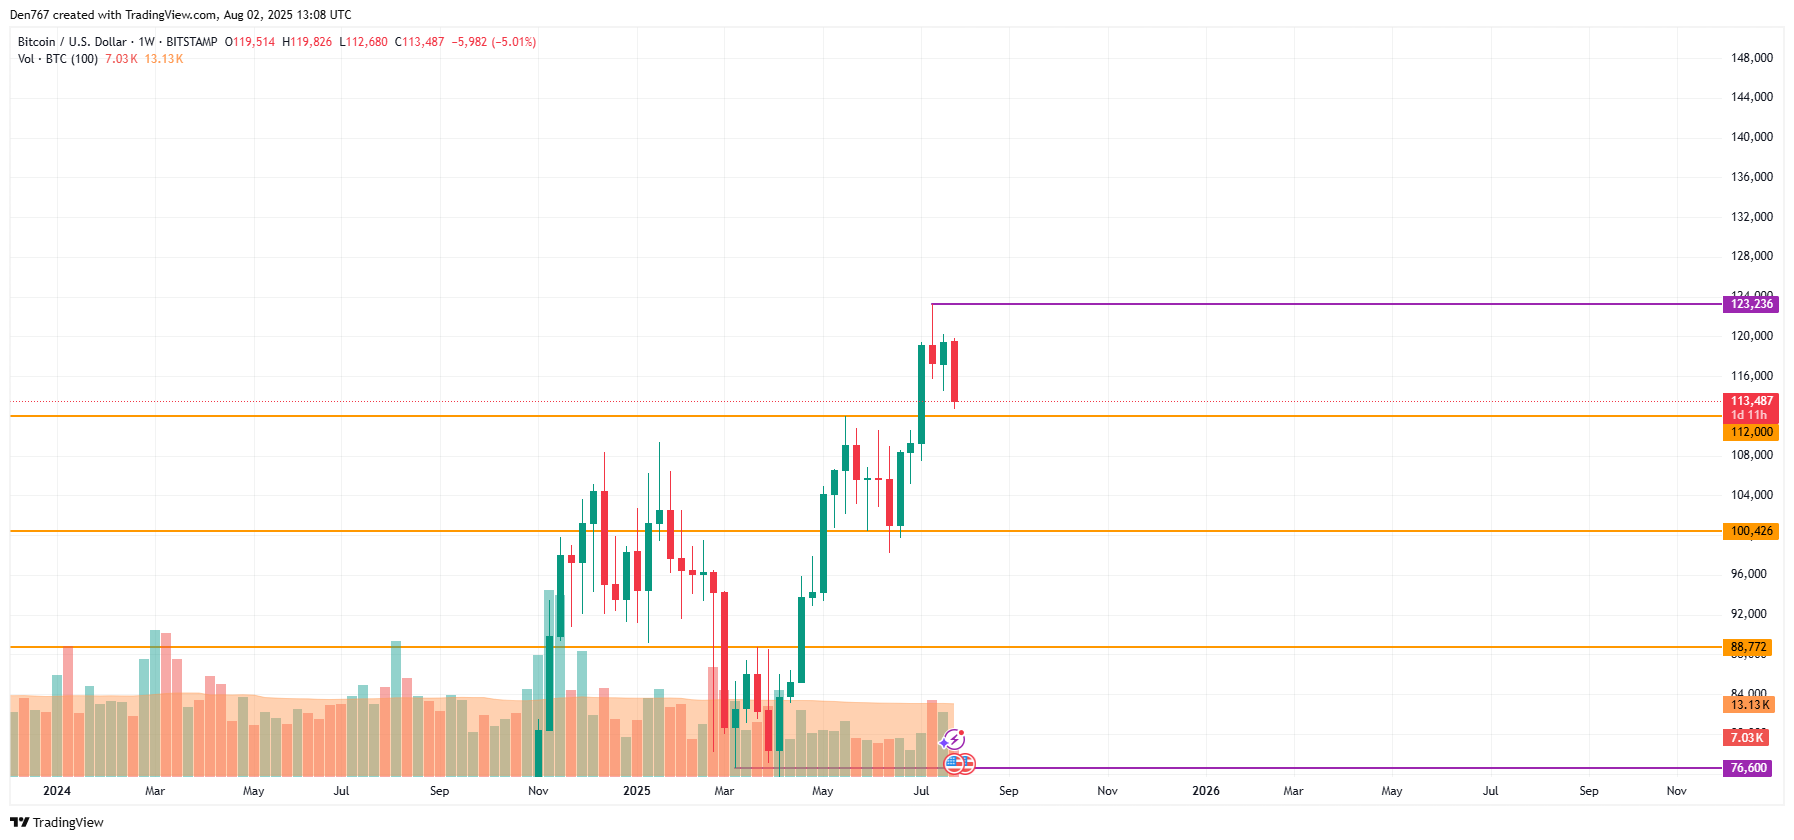
From the midterm point of view, the rate of BTC has almost touched the nearest level of $112,000. If its breakout happens, the accumulated energy might be enough for an ongoing correction to the $110,000 mark and below.
Bitcoin is trading at $113,489 at press time.