After the CPI print on July 15, Bitcoin faced a fresh wave of inflow pressure. Prices have already corrected from the recent high of $123,203 to $117,143, a 4.9% decline.
With bearish signs building and buyers stepping back, many now wonder if an 8% dip could still be on the table.
Exchange Inflows Signal Mounting Sell Pressure
Data from CryptoQuant shows that on July 15, over 80,810 BTC moved to centralized exchanges: the largest single-day inflow in days. This adds up to more than $9.4 billion worth of Bitcoin entering platforms.
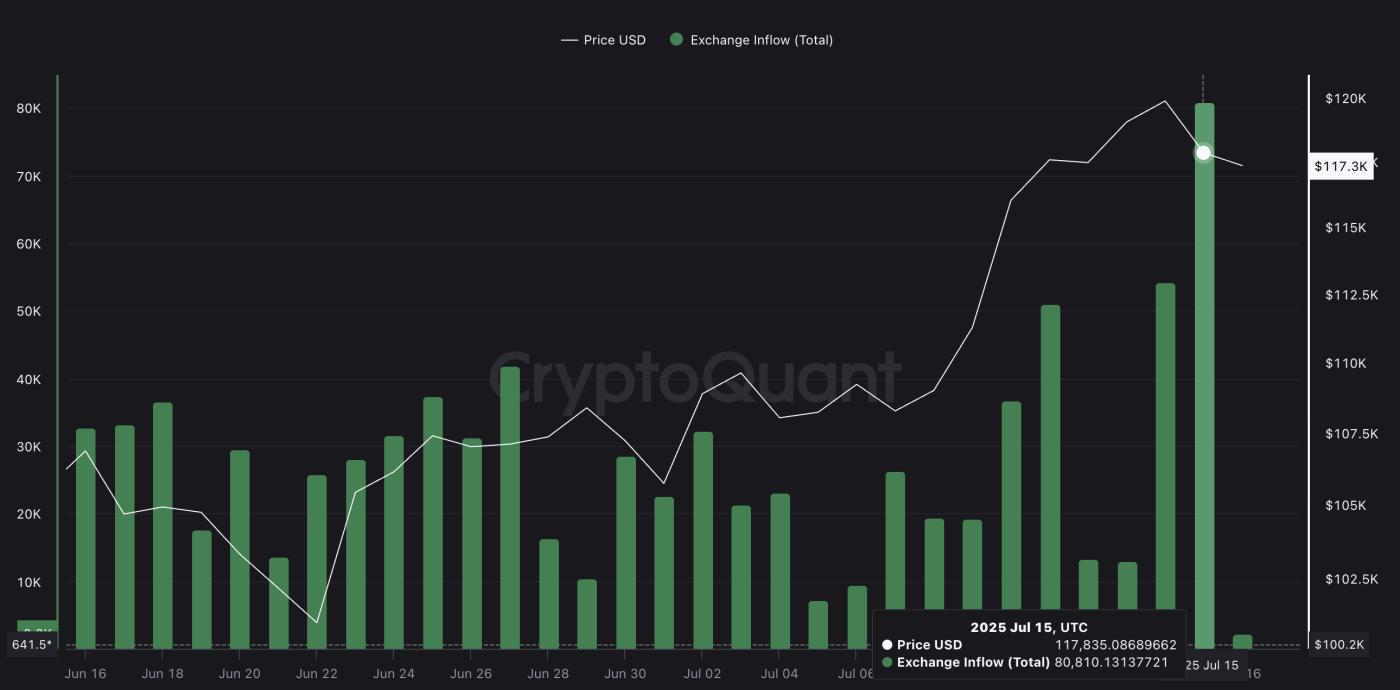 BTC price and rising exchange inflows: CryptoQuant
Exchange inflows typically reflect increased selling interest. When large volumes of BTC move from wallets to exchanges, it’s often a sign that holders are preparing to offload, especially when paired with weakening price action.
Accumulation Zones Offer Support
Glassnode’s heatmap shows previous strong buying zones between $93,000–$97,000 and $101,000–$109,000. These are ranges where BTC saw high wallet activity, meaning many investors bought in bulk. This creates “accumulation clusters” where price tends to find support during pullbacks.
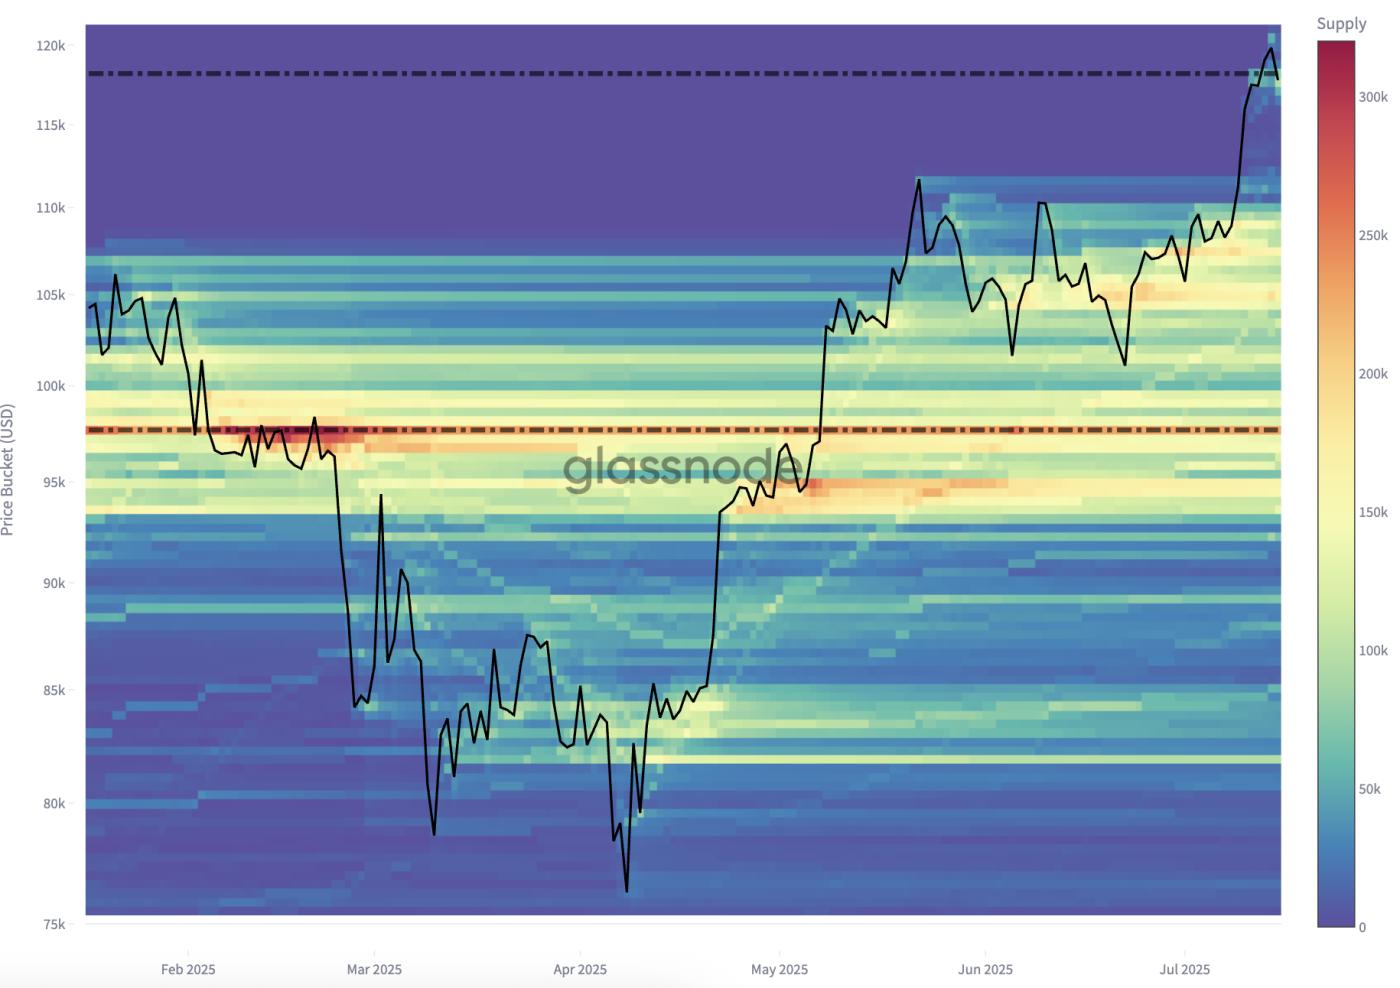 Key accumulation clusters for Bitcoin: Glassnode
Among these, the $107,000–$109,000 range is especially important. It’s close to where BTC traded sideways for several days before breaking out. If Bitcoin continues falling, this zone is where dip-buyers could start returning.
These accumulation zones represent areas with strong historical buying activity, which can act as natural support in a downtrend.
Bitcoin Price Structure Weakens; 8% Dip Still on the Table
Bitcoin is currently trading around $117,143, having slipped from its all-time high of $123,203. This drop of nearly 5% has pushed BTC below the 0.236 Fibonacci retracement level at $117,293, which was the first key support zone after the top.
Fibonacci retracement levels are drawn by measuring the distance between a market’s recent low and high; in this case, from the June swing low near $98,160 to the all-time high of $123,203. These levels help identify where the price might pull back during a trend.
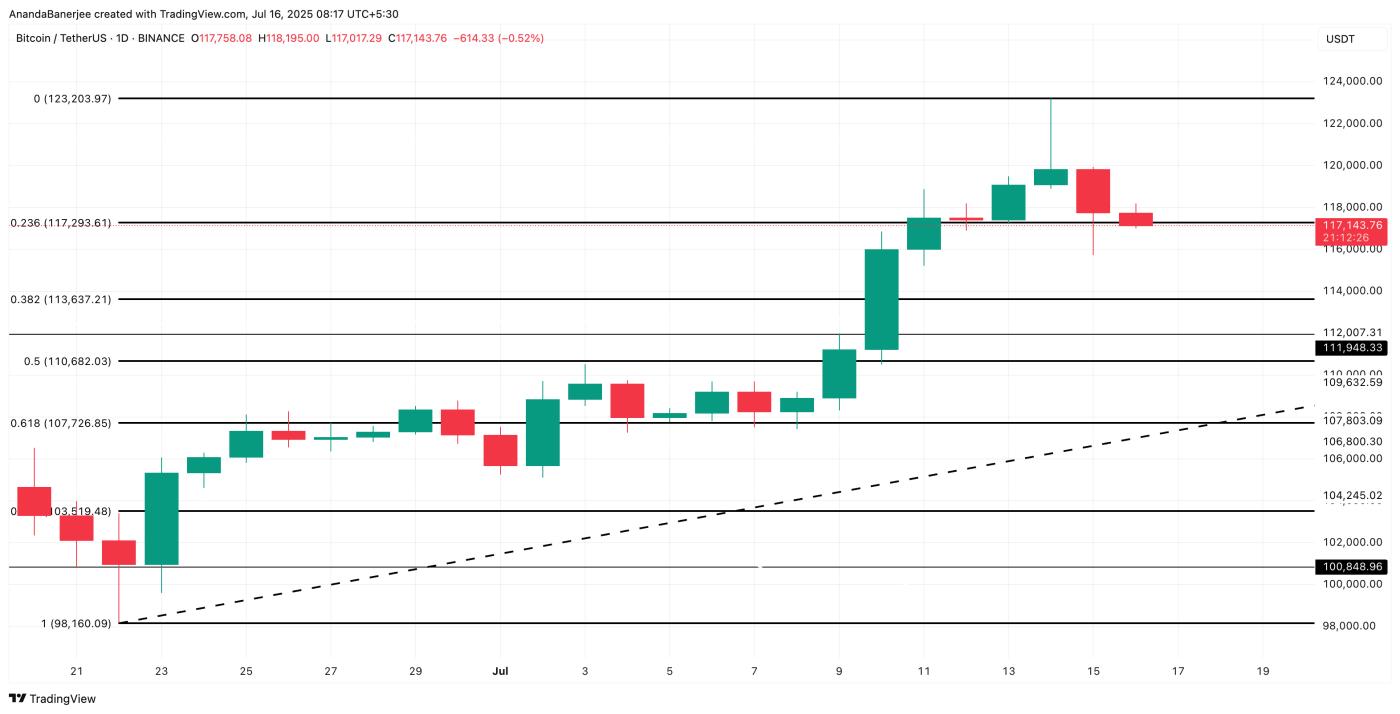 Bitcoin price analysis. Source: TradingView
Looking further down the Fibonacci ladder, the next significant level is the 0.618 retracement at $107,726. This level is widely viewed as a “golden pocket” where assets often bounce during healthy pullbacks.
There are intermediate levels at 0.382 ($113,637) and 0.5 ($110,682), but based on candle structure and lack of historical buying activity in these areas, they fall outside key accumulation zones and may offer limited support if BTC continues falling.
What strengthens the $107,726 zone even more is that it directly aligns with the $107,000–$109,000 accumulation cluster mentioned earlier.
If Bitcoin price falls from its current price to this 0.618 level, it would represent an additional 8% drop: a realistic target given the surge in exchange inflows and weakening structure. The overlap between this Fib level and previous buying activity makes $107,726 the most likely area for bulls to attempt a defense.
However, this scenario becomes invalidated if price reclaims the $117,293 level while experiencing a dip in exchange inflow numbers. A sustained recovery above that resistance could restore bullish momentum and put the $123,203 peak back in sight.