

Solana (SOL) has fallen by more than 11% over the past 7 days. Several technical indicators show weakened momentum and increasing downward pressure. The Relative Strength Index (RSI) has sharply declined, signaling a shift to a cautious market attitude.
At the same time, the Ichimoku chart and moving average structure show a downward trend. Key resistance levels remain solid, and support zones are at risk. Without a clear reversal, SOL may continue to face downward pressure in the short term.
Solana RSI Falls Below 45... Momentum Weakening
Solana's Relative Strength Index (RSI) has dropped to 40.77. This is a notable decline from 64.25 two days ago.
This sharp change reflects weakened upward momentum and suggests that recent selling pressure has exceeded buying interest.
The downward movement signals a potential transition to a cautious or bearish sentiment zone. This indicates that traders are beginning to reassess Solana's short-term outlook.
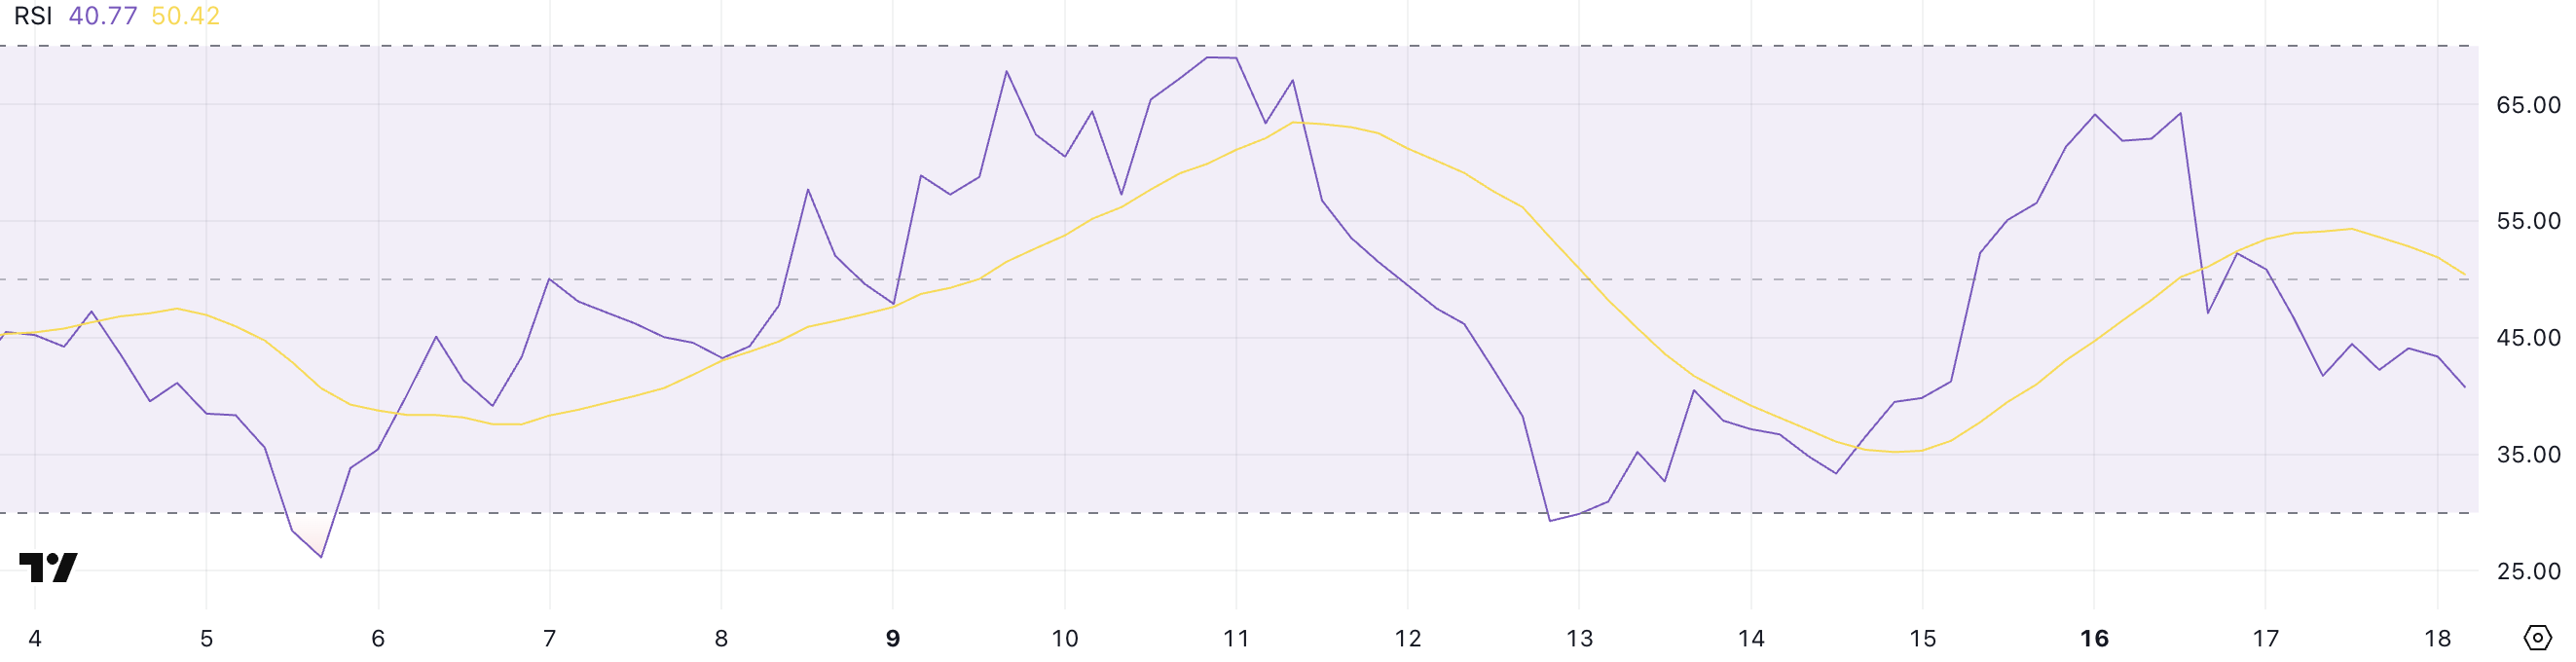
RSI is a widely used momentum indicator that measures the speed and magnitude of recent price changes. Ranging from 0 to 100, values above 70 indicate an overbought condition, often preceding a price correction. Values below 30 indicate an oversold condition and potentially signal a price rebound.
A reading close to 40.77 places Solana in a neutral to weak zone. This implies that the asset is losing upward momentum but has not yet reached the oversold area.
If the RSI continues to fall, it may indicate additional downward risk, while stabilizing above 40 could help establish a bottom before the next movement.
Declining Ichimoku Structure Pressures SOL
Solana's Ichimoku chart indicates a downward trend. Price movement is currently trading below the cloud (Kumo) shaded in red.
This red cloud represents current downward momentum and acts as a dynamic resistance. Leading Span A (the green line forming the top edge of the cloud) remains below Leading Span B (the red line forming the bottom edge), reinforcing the downward structure.
The upcoming cloud is also red and relatively thick, suggesting strong upper resistance. This makes an upward reversal more difficult unless significant momentum is generated.
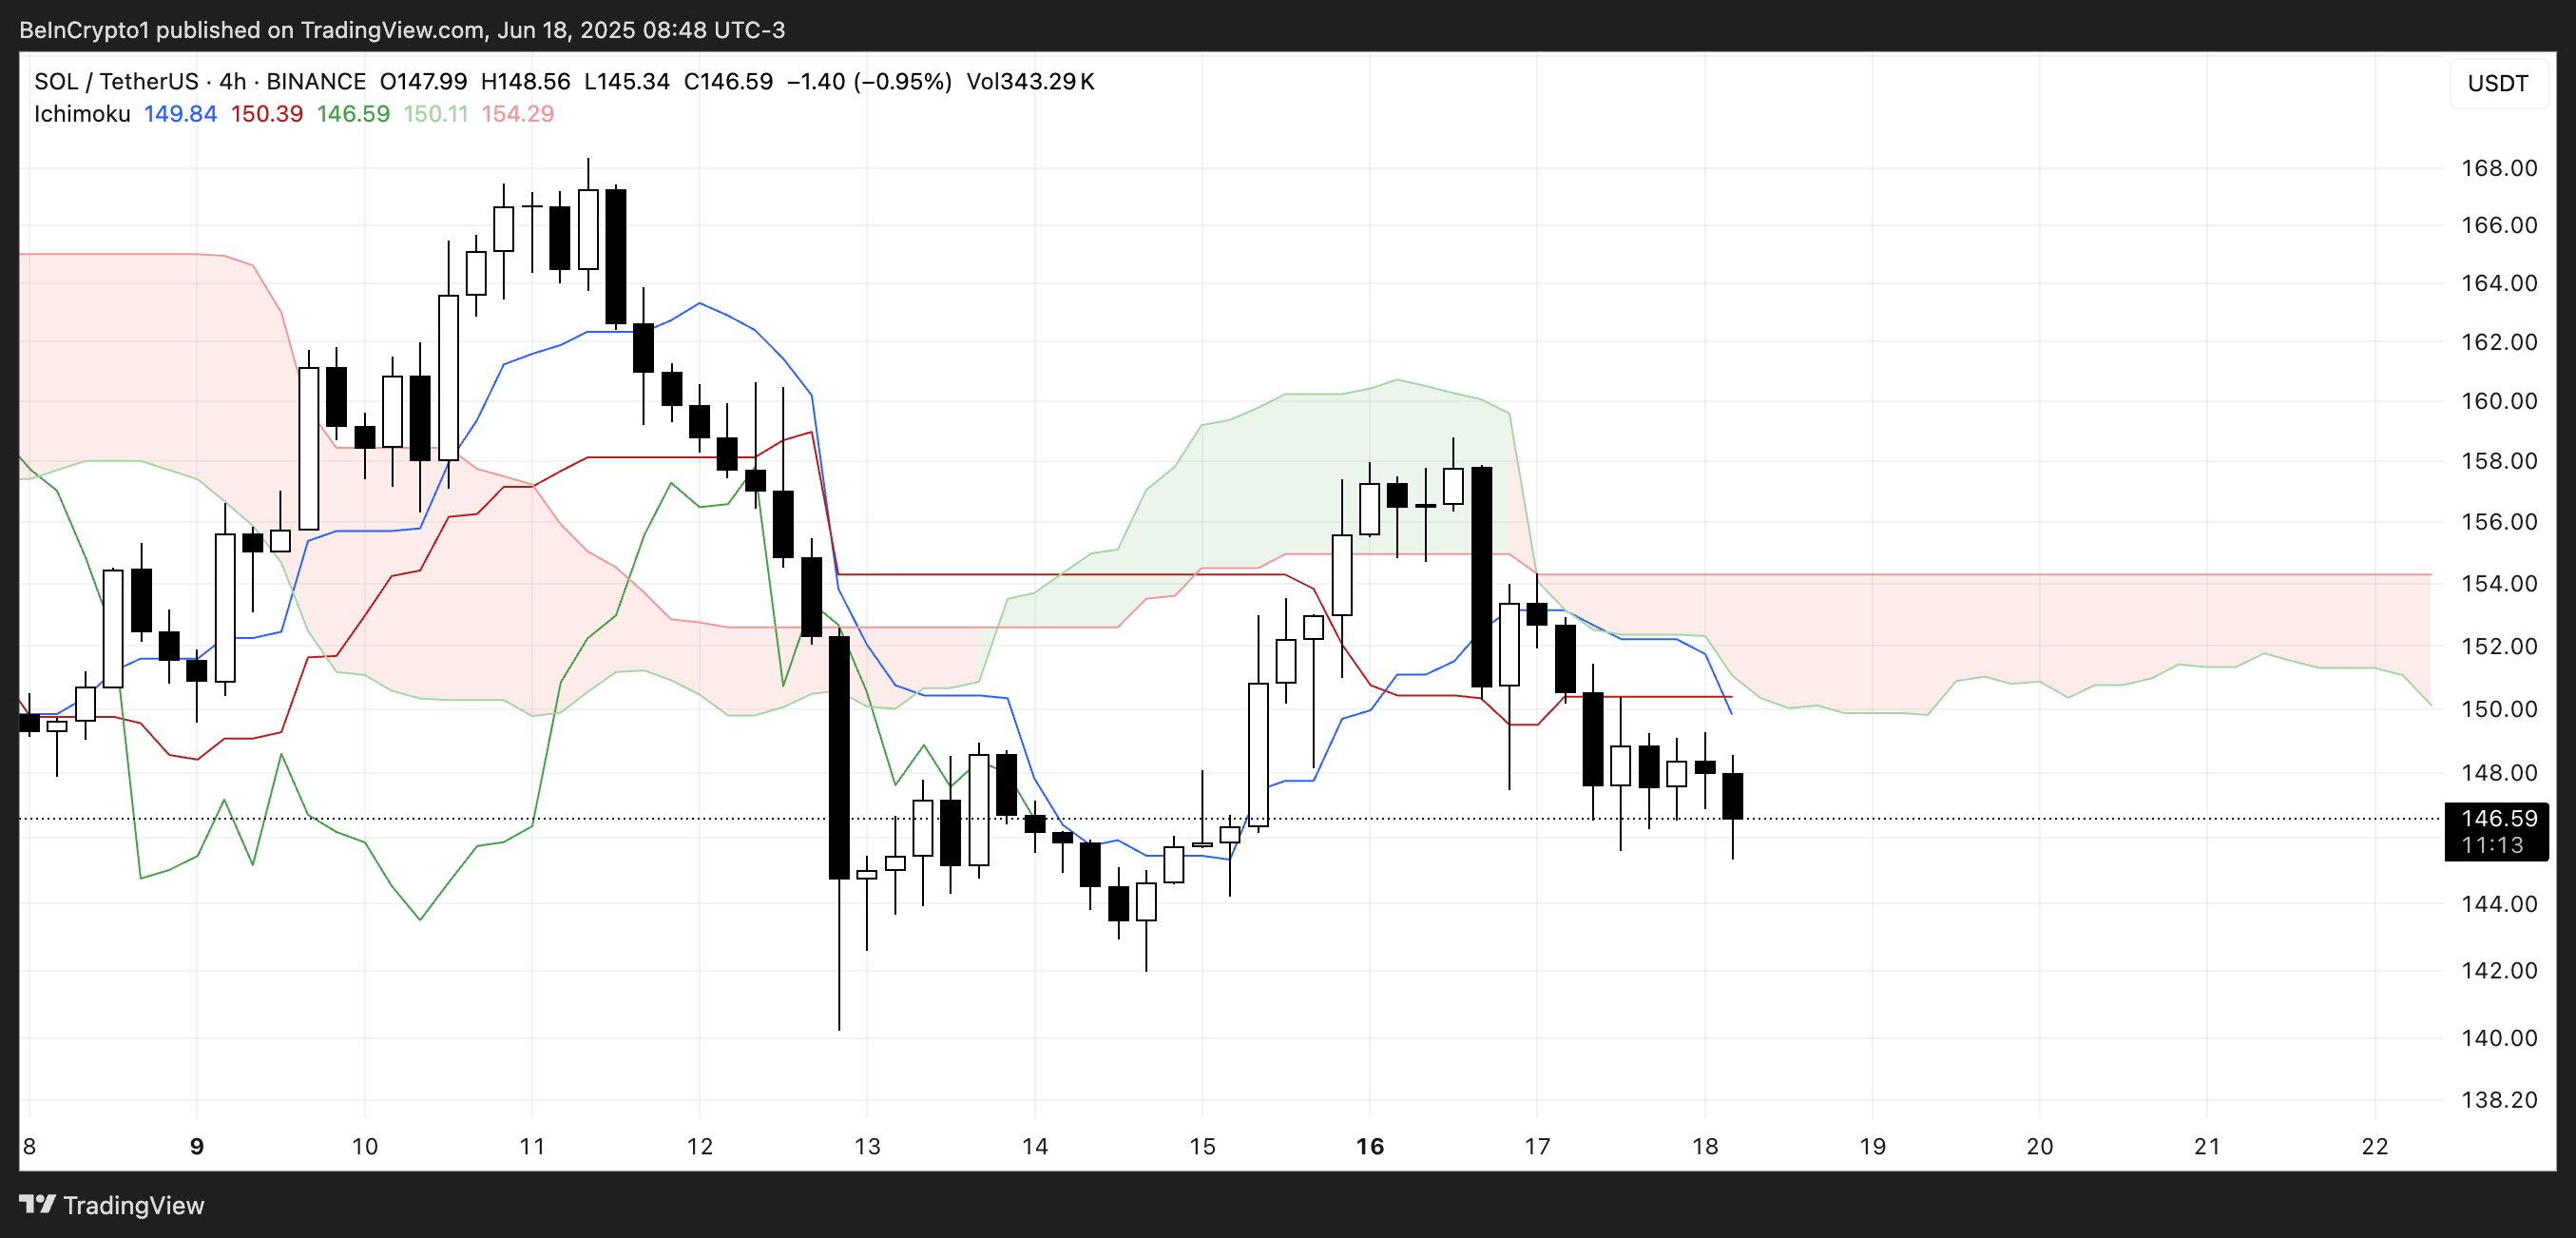
The Conversion Line (blue line) is currently below the Base Line (red line), another typical bearish signal. These two lines have also flattened, indicating a correction rather than a strong directional movement.
Candles are not crossing the Conversion Line, suggesting weak short-term momentum.
Unless a bullish crossover occurs or price movement breaks through the cloud, Solana faces downward pressure from an Ichimoku perspective.
SOL Still Weak on Moving Average Indicators
Solana's moving average structure remains in a downward trend. Short-term moving averages positioned below long-term moving averages indicate continued downward momentum.
This structure emerged after SOL attempted to reverse its trend two days ago but was rejected.
If the downward alignment is maintained, the asset could test the immediate support level of $141.53.

A drop below this could open the door to further decline, potentially pushing SOL below $140 for the first time since April 21.
Conversely, if the trend reverses and short-term moving averages begin to curve upward, Solana could retest the resistance zone around $150.59.
Clearly breaking this level would be the first signal of a potential trend reversal. If buying momentum strengthens beyond this point, the next resistance targets are at $163.64 and $168.36.
For a long-term rally, SOL could aim for the next major upward level at $179.41.


