Bitcoin (BTC) is trading again near $111,000, rising approximately 4.5% over the past 7 days. The price has maintained levels above $105,000 over the past 4 days, strengthening market bullish sentiment.
This stable performance emerged amid whale accumulation pausing, and strong technical indicators including rising moving average (EMA) alignment and Ichimoku Cloud support. As BTC tests key resistance levels, traders are carefully observing whether momentum will continue or a correction will occur.
BTC Whales Halt Accumulation
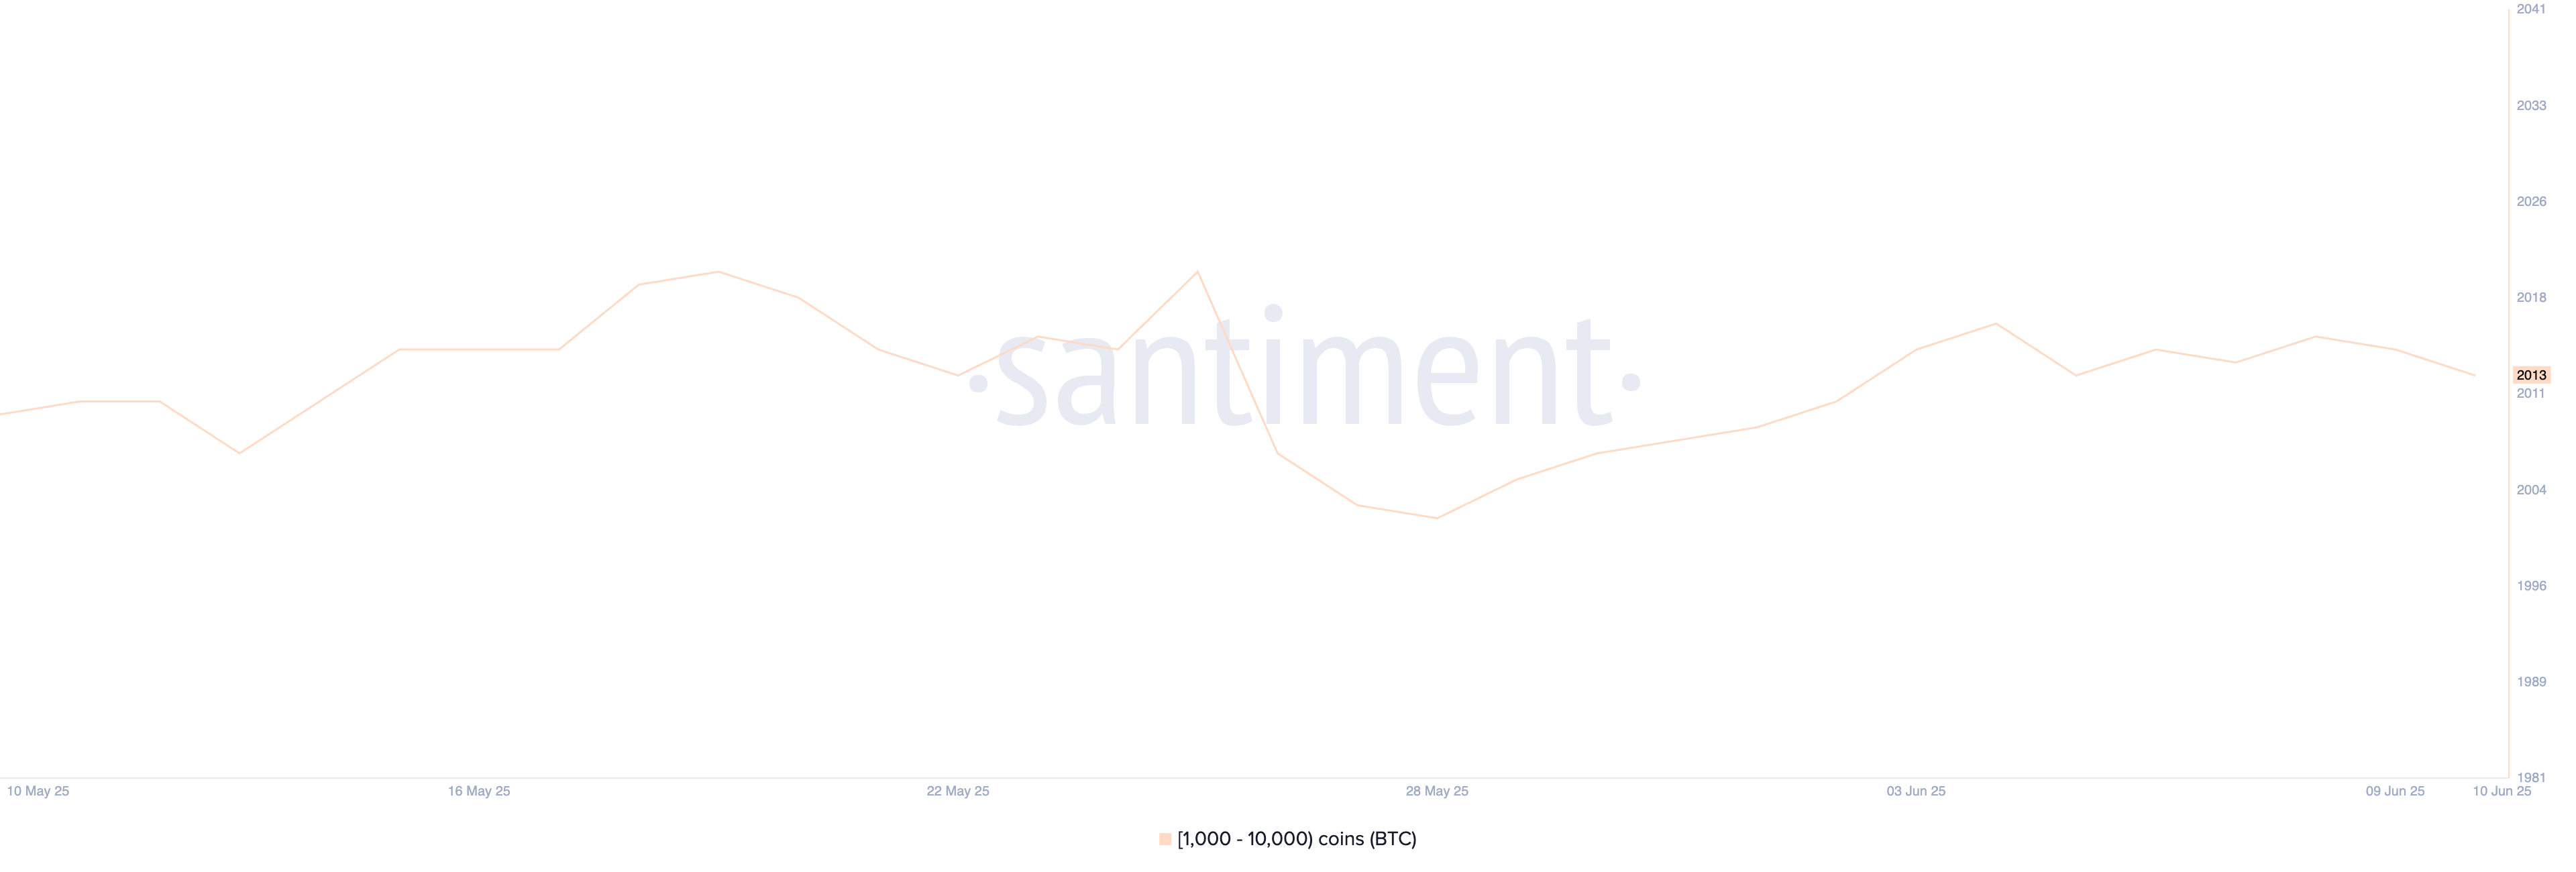
From May 28 to June 4, the number of Bitcoin whale wallets holding 1,000 to 10,000 BTC increased from 2,002 to 2,017.
This brief increase suggested renewed interest from large holders often considered smart money. However, since then, whale numbers have stabilized between 2,013 and 2,016 over the past week, currently at 2,013.
The absence of continued growth indicates a temporary pause in aggressive accumulation.
Tracking Bitcoin whales is important as their movements often precede major price movements. These large holders can influence market sentiment, create liquidity waves, and signal institutional confidence or attention.
The current stagnation in whale activity may reflect a wait-and-see approach amid uncertain macro or technical conditions.
While recent gains suggested accumulation, subsequent stagnation implies whales might hesitate to inject additional capital at current price levels. This could limit short-term gains unless new catalysts emerge.
Bitcoin Maintains Ichimoku Cloud... Momentum Stagnates
Bitcoin's Ichimoku chart shows the price remaining above the green cloud, reflecting an upward market structure.
Leading Span A (cloud's upper edge) shows an upward trend, with the cloud's green indicating continued upward momentum. The cloud acts as a potential support zone.
The recent breakout from the red cloud confirms buyers have taken control after a correction.

The blue line (conversion line) remains above the red line (base line), another bullish signal indicating short-term momentum is stronger than medium-term trend.
However, both lines have flattened slightly, suggesting a potential pause or minor correction.
The green lagging span is positioned above price and cloud, reinforcing bullish bias. But convergence with current price movement suggests potential downward movement below the conversion line could require attention.
BTC Tests Key Support Levels
Bitcoin's EMA structure shows short-term EMAs consistently positioned above long-term EMAs, maintaining a healthy gap that confirms a strong upward trend.
This alignment confirms strong upward momentum and suggests the trend remains intact unless interrupted.
As BTC price approaches the next resistance level, breaking through could open paths for additional gains and potentially set a new short-term peak.
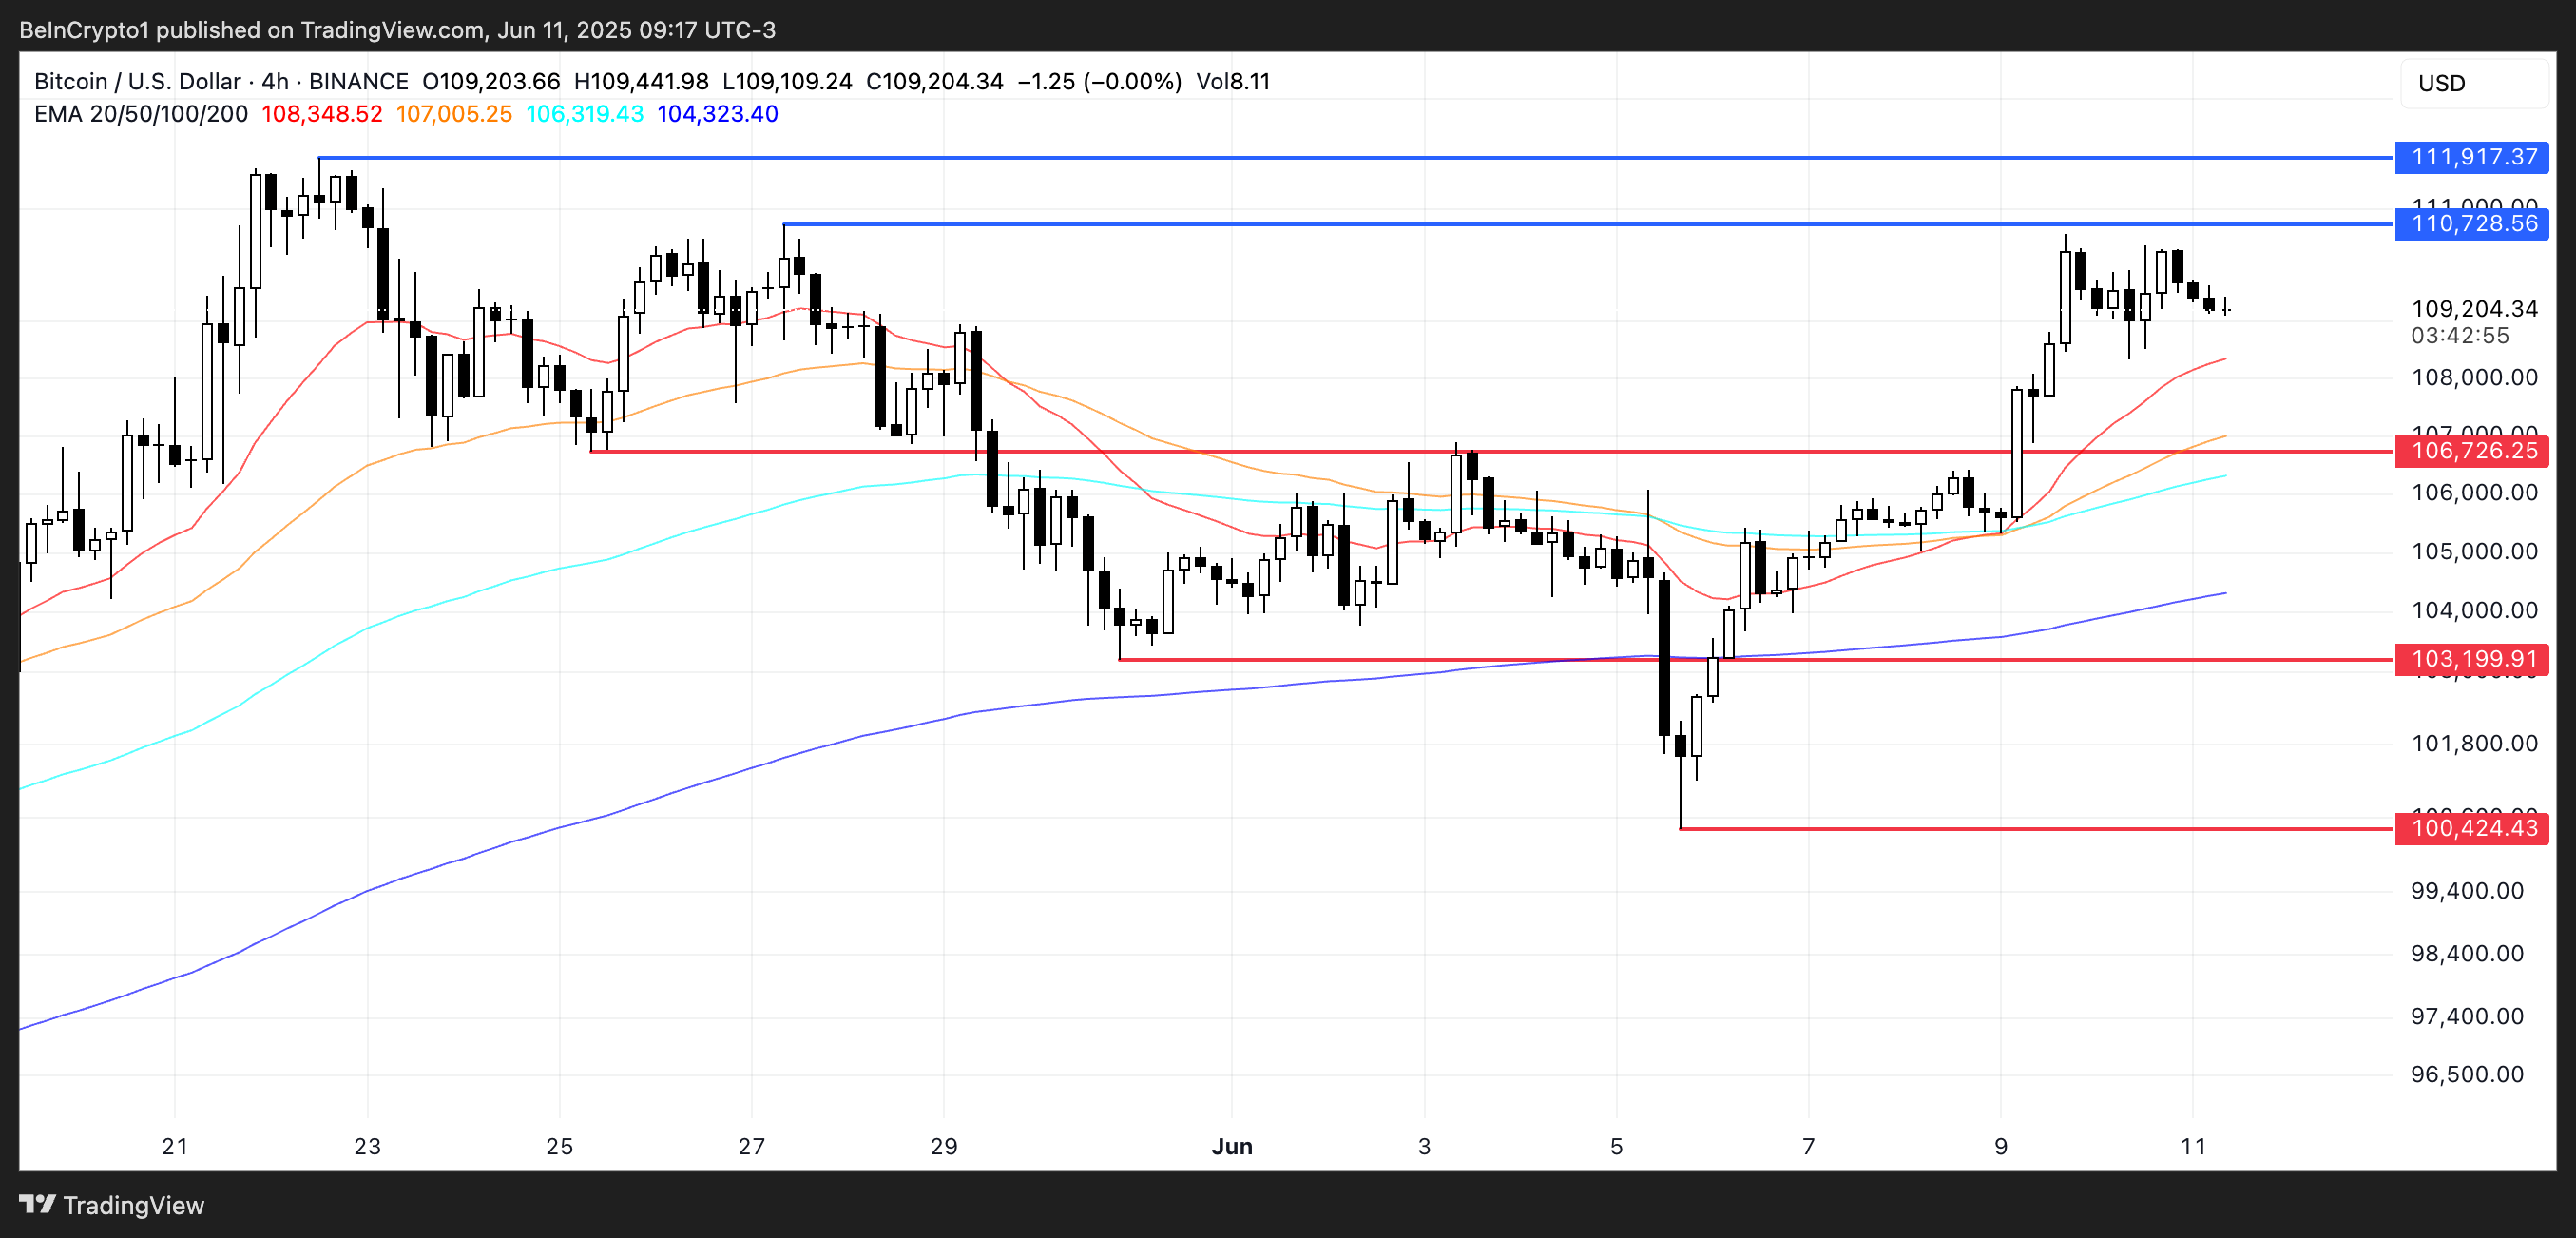
However, downside risks still exist. If support near $108,000 fails, BTC could enter a correction phase, gradually targeting lower support levels.
A drop below the $106,700 region would open doors to deeper correction, with the $103,000 and $104,000 areas potentially becoming targets in a strong downward movement.