

XRP has been steadily rising over the past few days due to decreased liquidation activities by long-term holders (LTH).
According to on-chain data, token movement among these investors has significantly slowed down. This indicates that LTHs are maintaining their positions without selling. This suggests a potential continued price increase in the short term.
XRP, Decrease in Long-Term Holder Sales... Accumulation Signal
According to glassnode data, XRP's liveliness has been steadily decreasing since June 5th, reaching 0.809, a 1% drop as of June 8th. This indicates reduced activity among LTHs.
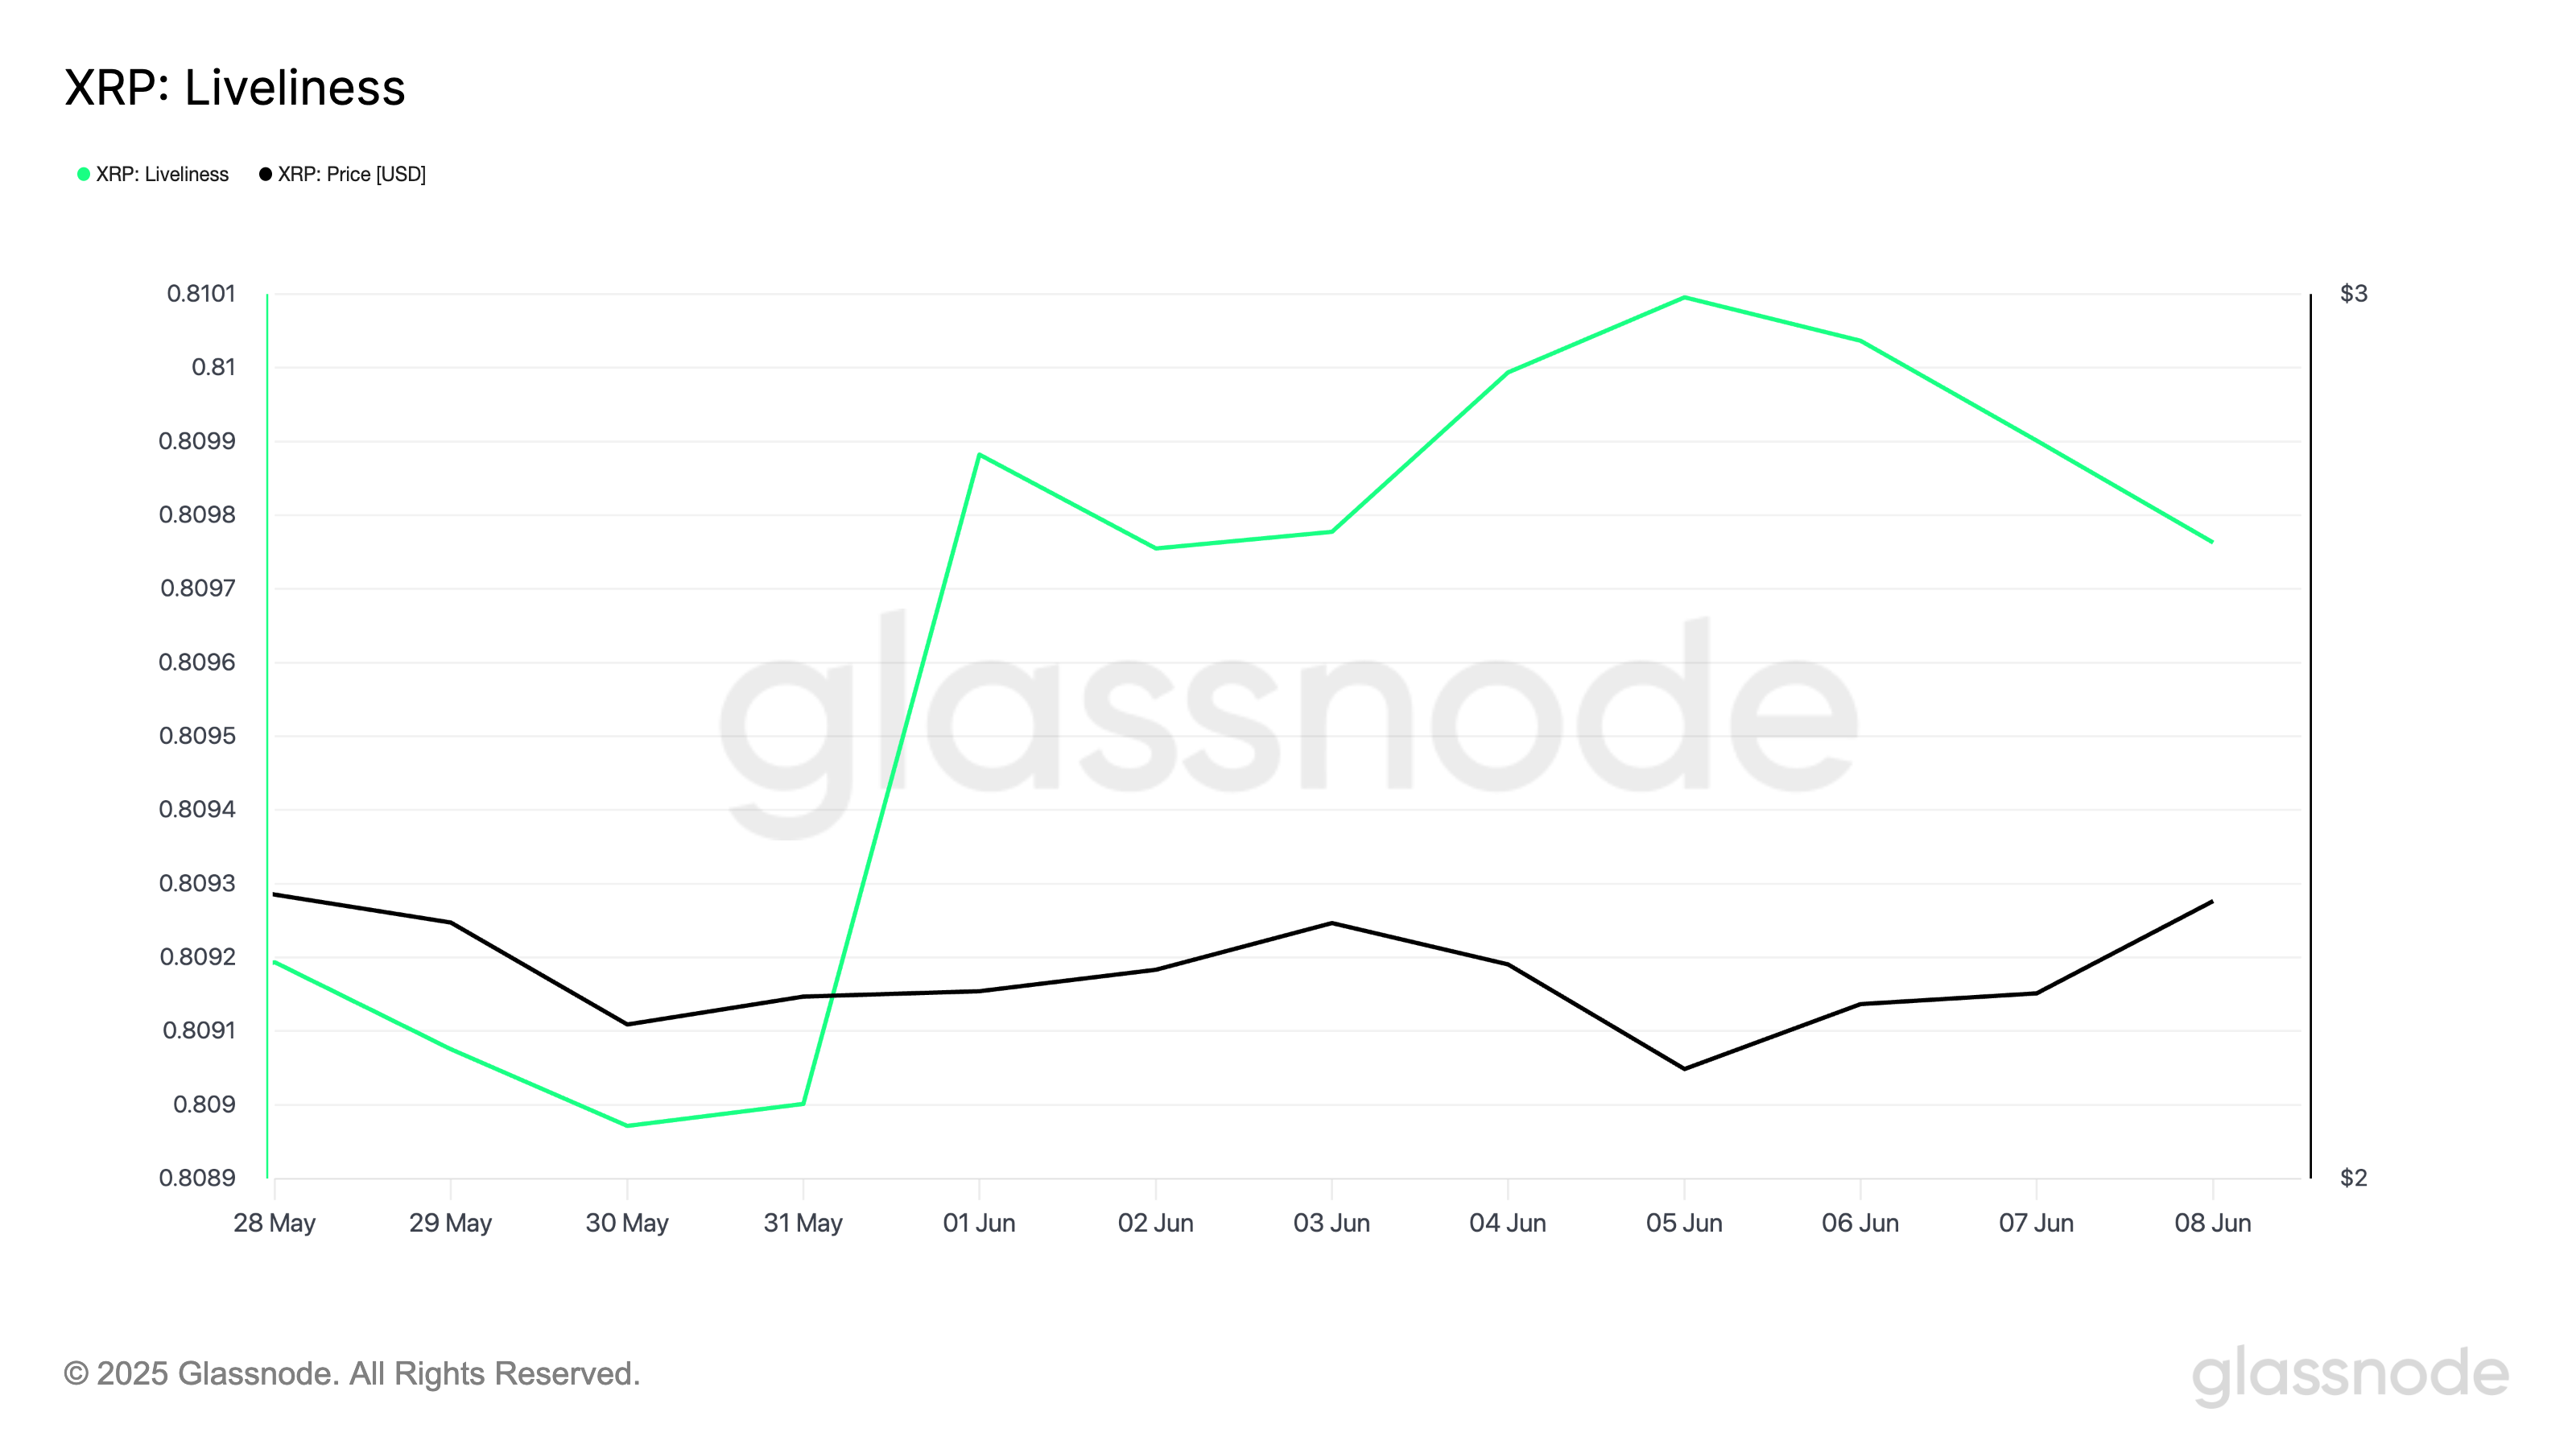
Liveliness tracks the movement of long-term held/dormant tokens by measuring the ratio of coin days destroyed to total coin days. When this indicator rises, it means LTHs are moving or selling coins.
Conversely, when it falls like this, it suggests that LTHs are moving assets away from exchanges, which is typically considered a buy signal.
Additionally, these positive changes in holder behavior are reflected in the XRP derivatives market. A consistently positive funding rate has been maintained since June 6th. Currently, this rate is 0.0080%, indicating that most traders are anticipating an upward trend.
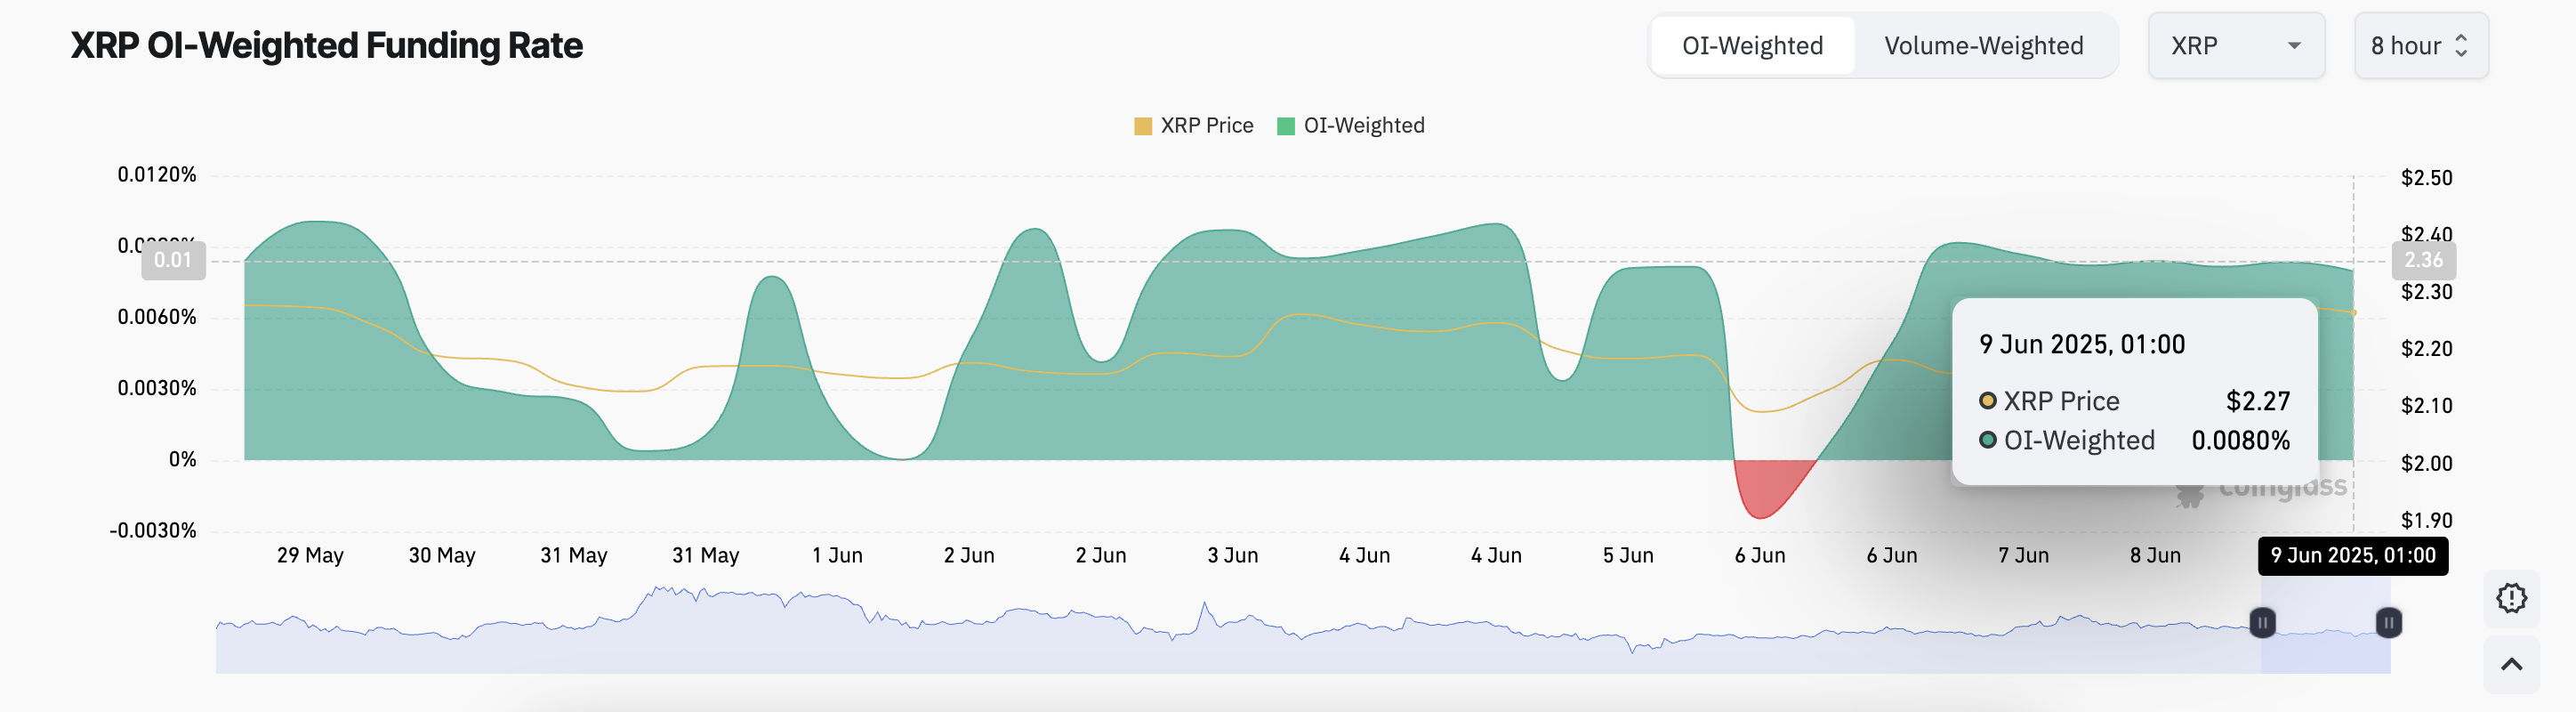
The funding rate is a fee periodically exchanged between traders in the perpetual futures market. It is used to align contract prices with spot prices.
When the funding rate is positive, long positions are dominant, and short sellers are willing to pay to maintain their positions. This indicates strong buying sentiment.
XRP, Between Breakout and Correction... Golden Cross Imminent
Indicators on the XRP/USD daily chart confirm a potential upward reversal. The token's Moving Average Convergence Divergence (MACD) indicator suggests a golden cross formation. This occurs when the MACD line (blue) is preparing to cross above the signal line (orange), typically considered a bullish momentum signal.
The MACD indicator identifies trends and momentum in an asset's price movement. It helps traders capture potential buy or sell signals through the crossover between the MACD and signal lines. When the MACD line is above the signal line, it indicates upward momentum and suggests the asset's price may continue to rise.
A successful golden cross formation could confirm XRP's upward trend and potentially push the price beyond the $2.29 resistance to $2.50.
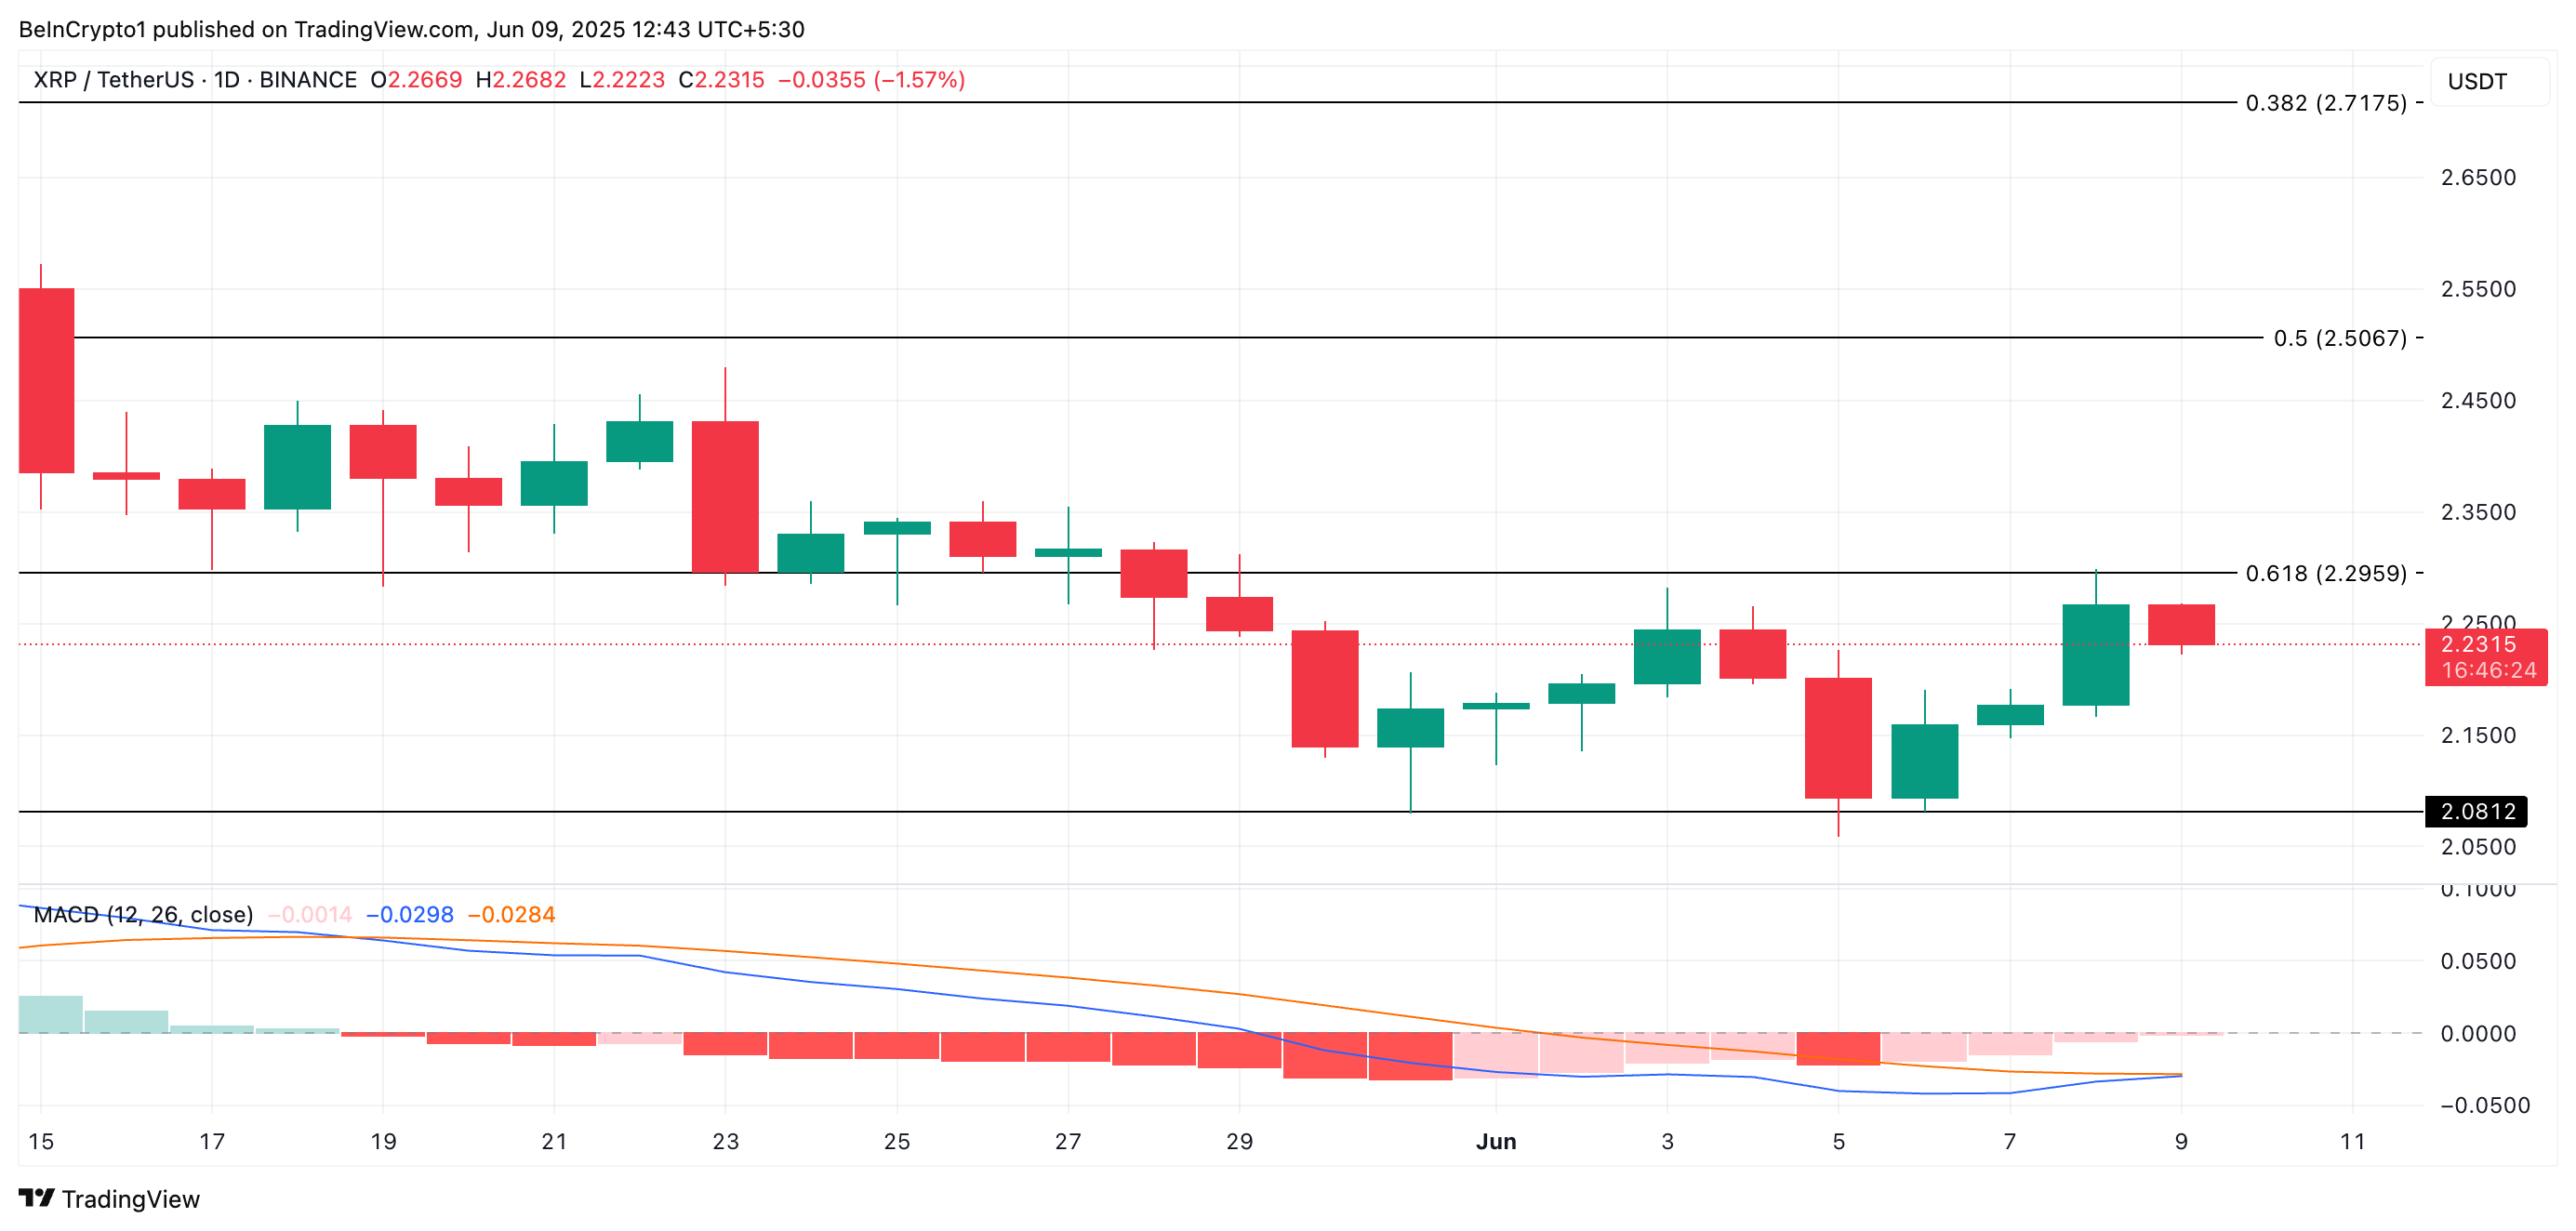
Conversely, if a downward trend reappears, the altcoin could lose some of its gains and drop to $2.08.


