

Hedera (HBAR) rose by 5% over the past 7 days but declined by almost 4.5% in the last 24 hours. Trading volume decreased by 25%, dropping to $241 million. This adjustment occurred as several indicators, including BBTrend's sharp decline and RSI approaching the oversold area, pointed to weakening momentum.
Price movement is trapped between major support and resistance levels. The EMA lines still maintain an upward structure, but short-term average lines have begun to curve downward. Whether HBAR will decline or recover depends on its reaction in the upcoming session within the $0.191 to $0.202 range.
HBAR Trend Strength Weakening... BBTrend Below 6
Hedera's BBTrend dropped from 16.48 to 5.95 three days ago, clearly indicating a slowdown in trend strength.
Despite remaining in the positive area for the past 5 days, this sharp decline suggests that HBAR's upward momentum is weakening.
A declining BBTrend often signals a period of adjustment or reversal, accompanied by other signs of cooling volatility or trading volume.
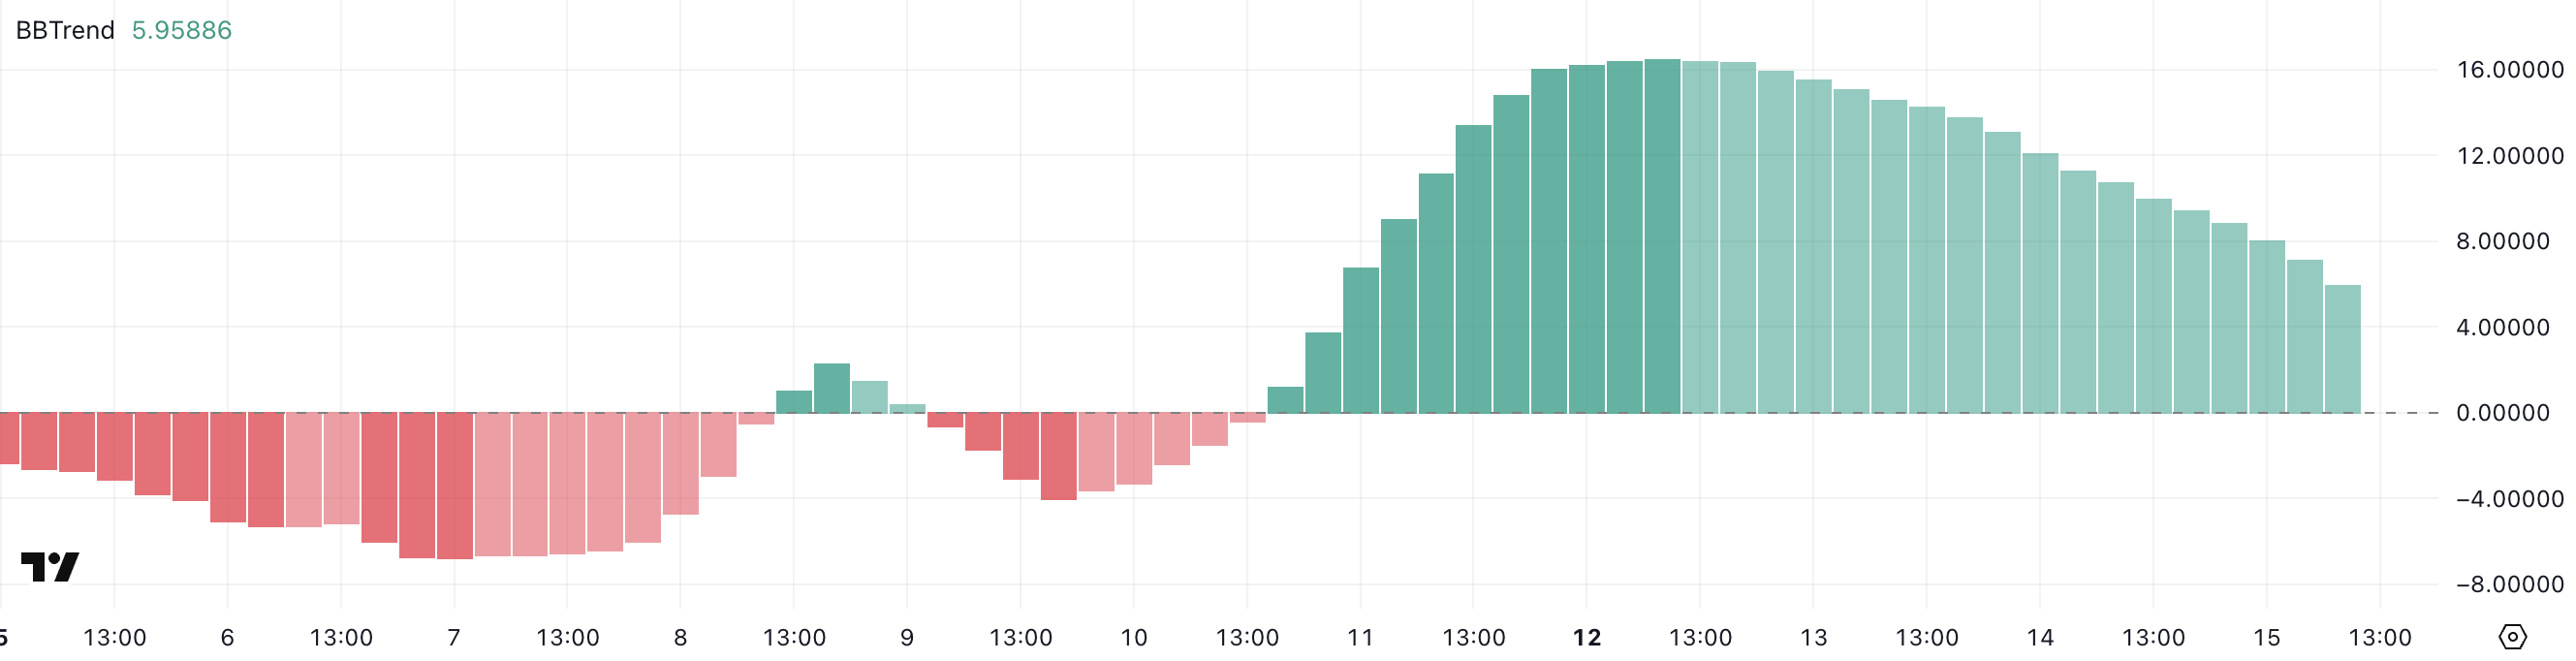
The BBTrend indicator measures price trend strength using Bollinger Bands, which are volatility-based lines drawn above and below the moving average.
When BBTrend values rise, it typically indicates increasing distance between price and Bollinger Bands, signaling stronger trend strength. Conversely, a declining BBTrend like HBAR's current 5.95 suggests the trend is weakening.
If this value continues to fall, it may mean Hedera could enter a consolidation or adjustment phase unless new momentum emerges.
Hedera Momentum Decreasing... RSI Below 40
Hedera's RSI has significantly dropped to 39.75, down from 59.88 two days ago and the recent peak of 82.53 five days ago.
This sharp decline reflects a sudden loss of strong upward momentum and a change in sentiment. Traders appear to be reducing positions after an overbought phase.
This movement places HBAR's RSI just above the oversold threshold, indicating rapidly increasing downward pressure over the past week.
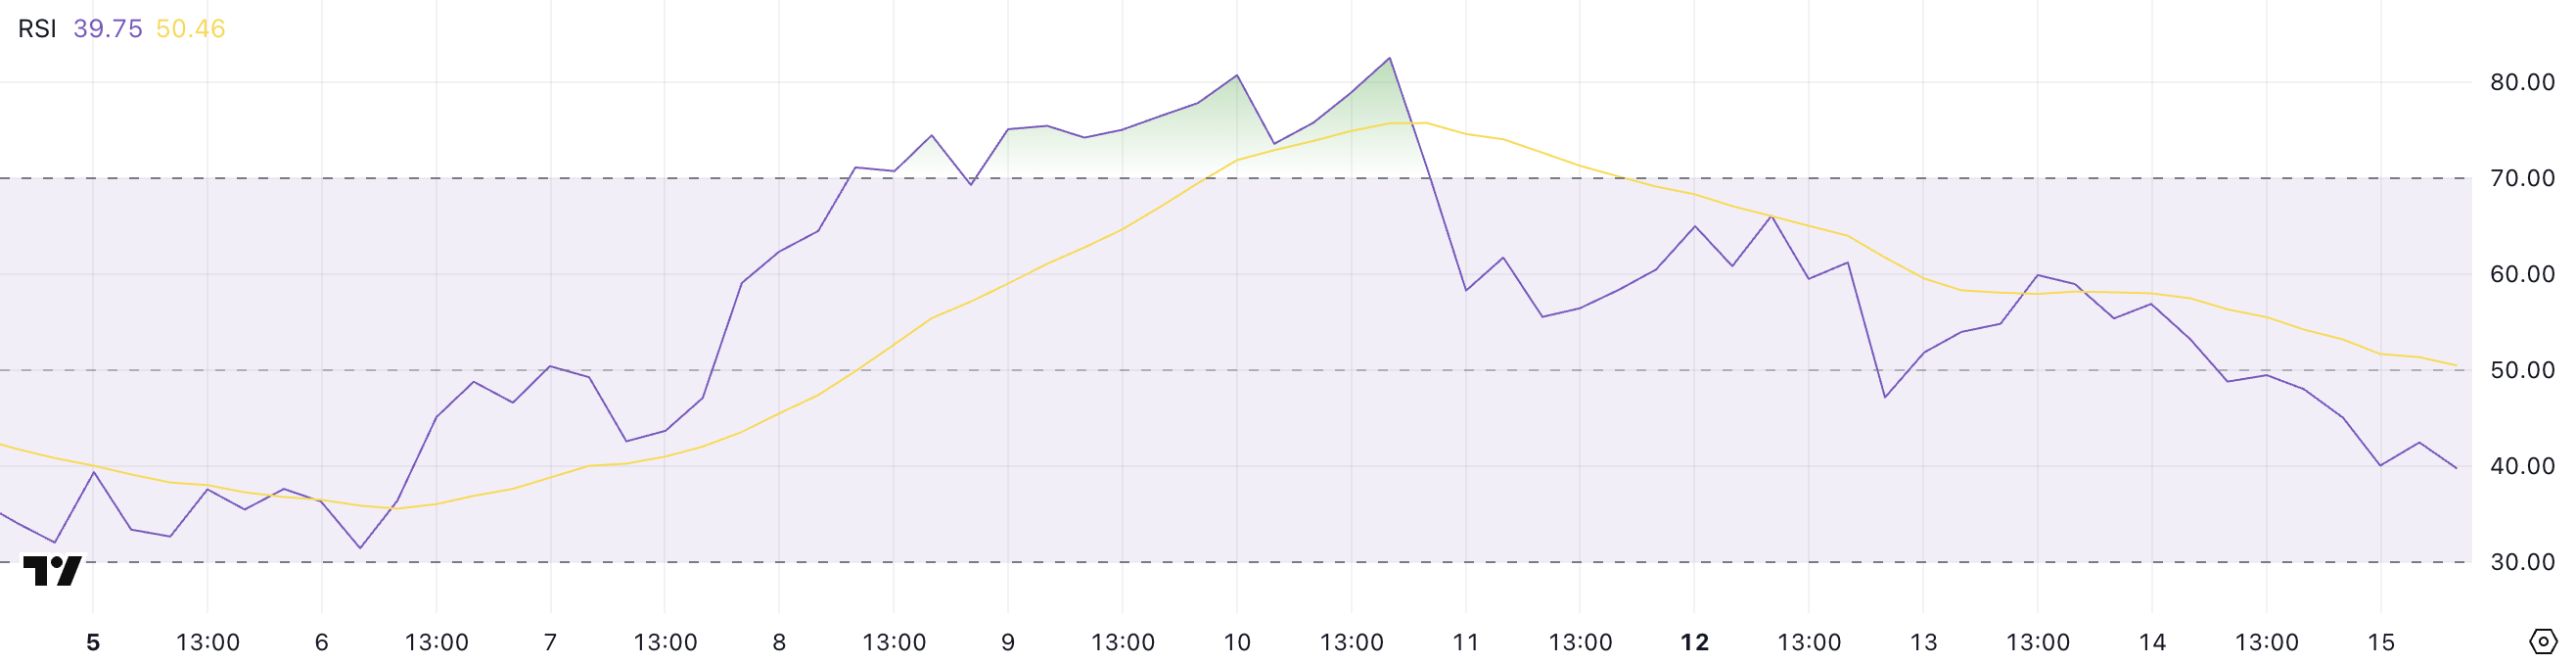
The Relative Strength Index (RSI) is a momentum indicator ranging from 0 to 100, used to assess whether an asset is overbought or oversold.
Values above 70 typically suggest an overbought condition and potential correction, while values below 30 indicate an oversold area and potential rebound.
With Hedera's RSI currently at 39.75, the asset is approaching oversold status but hasn't yet crossed the threshold. Continued RSI decline could suggest further drops, but buyer intervention at current levels might lead to a technical rebound.
HBAR, Breaking Key $0.191–$0.202 Range Crucial
Hedera's price is currently consolidating between major technical levels, with resistance at $0.202 and support at $0.191. EMA lines still show an upward configuration, with short-term average lines positioned above long-term average lines, maintaining a broader trend.
However, short-term EMA has begun curving downward, increasing the risk of a potential death cross. This descending crossover could confirm deeper declines.
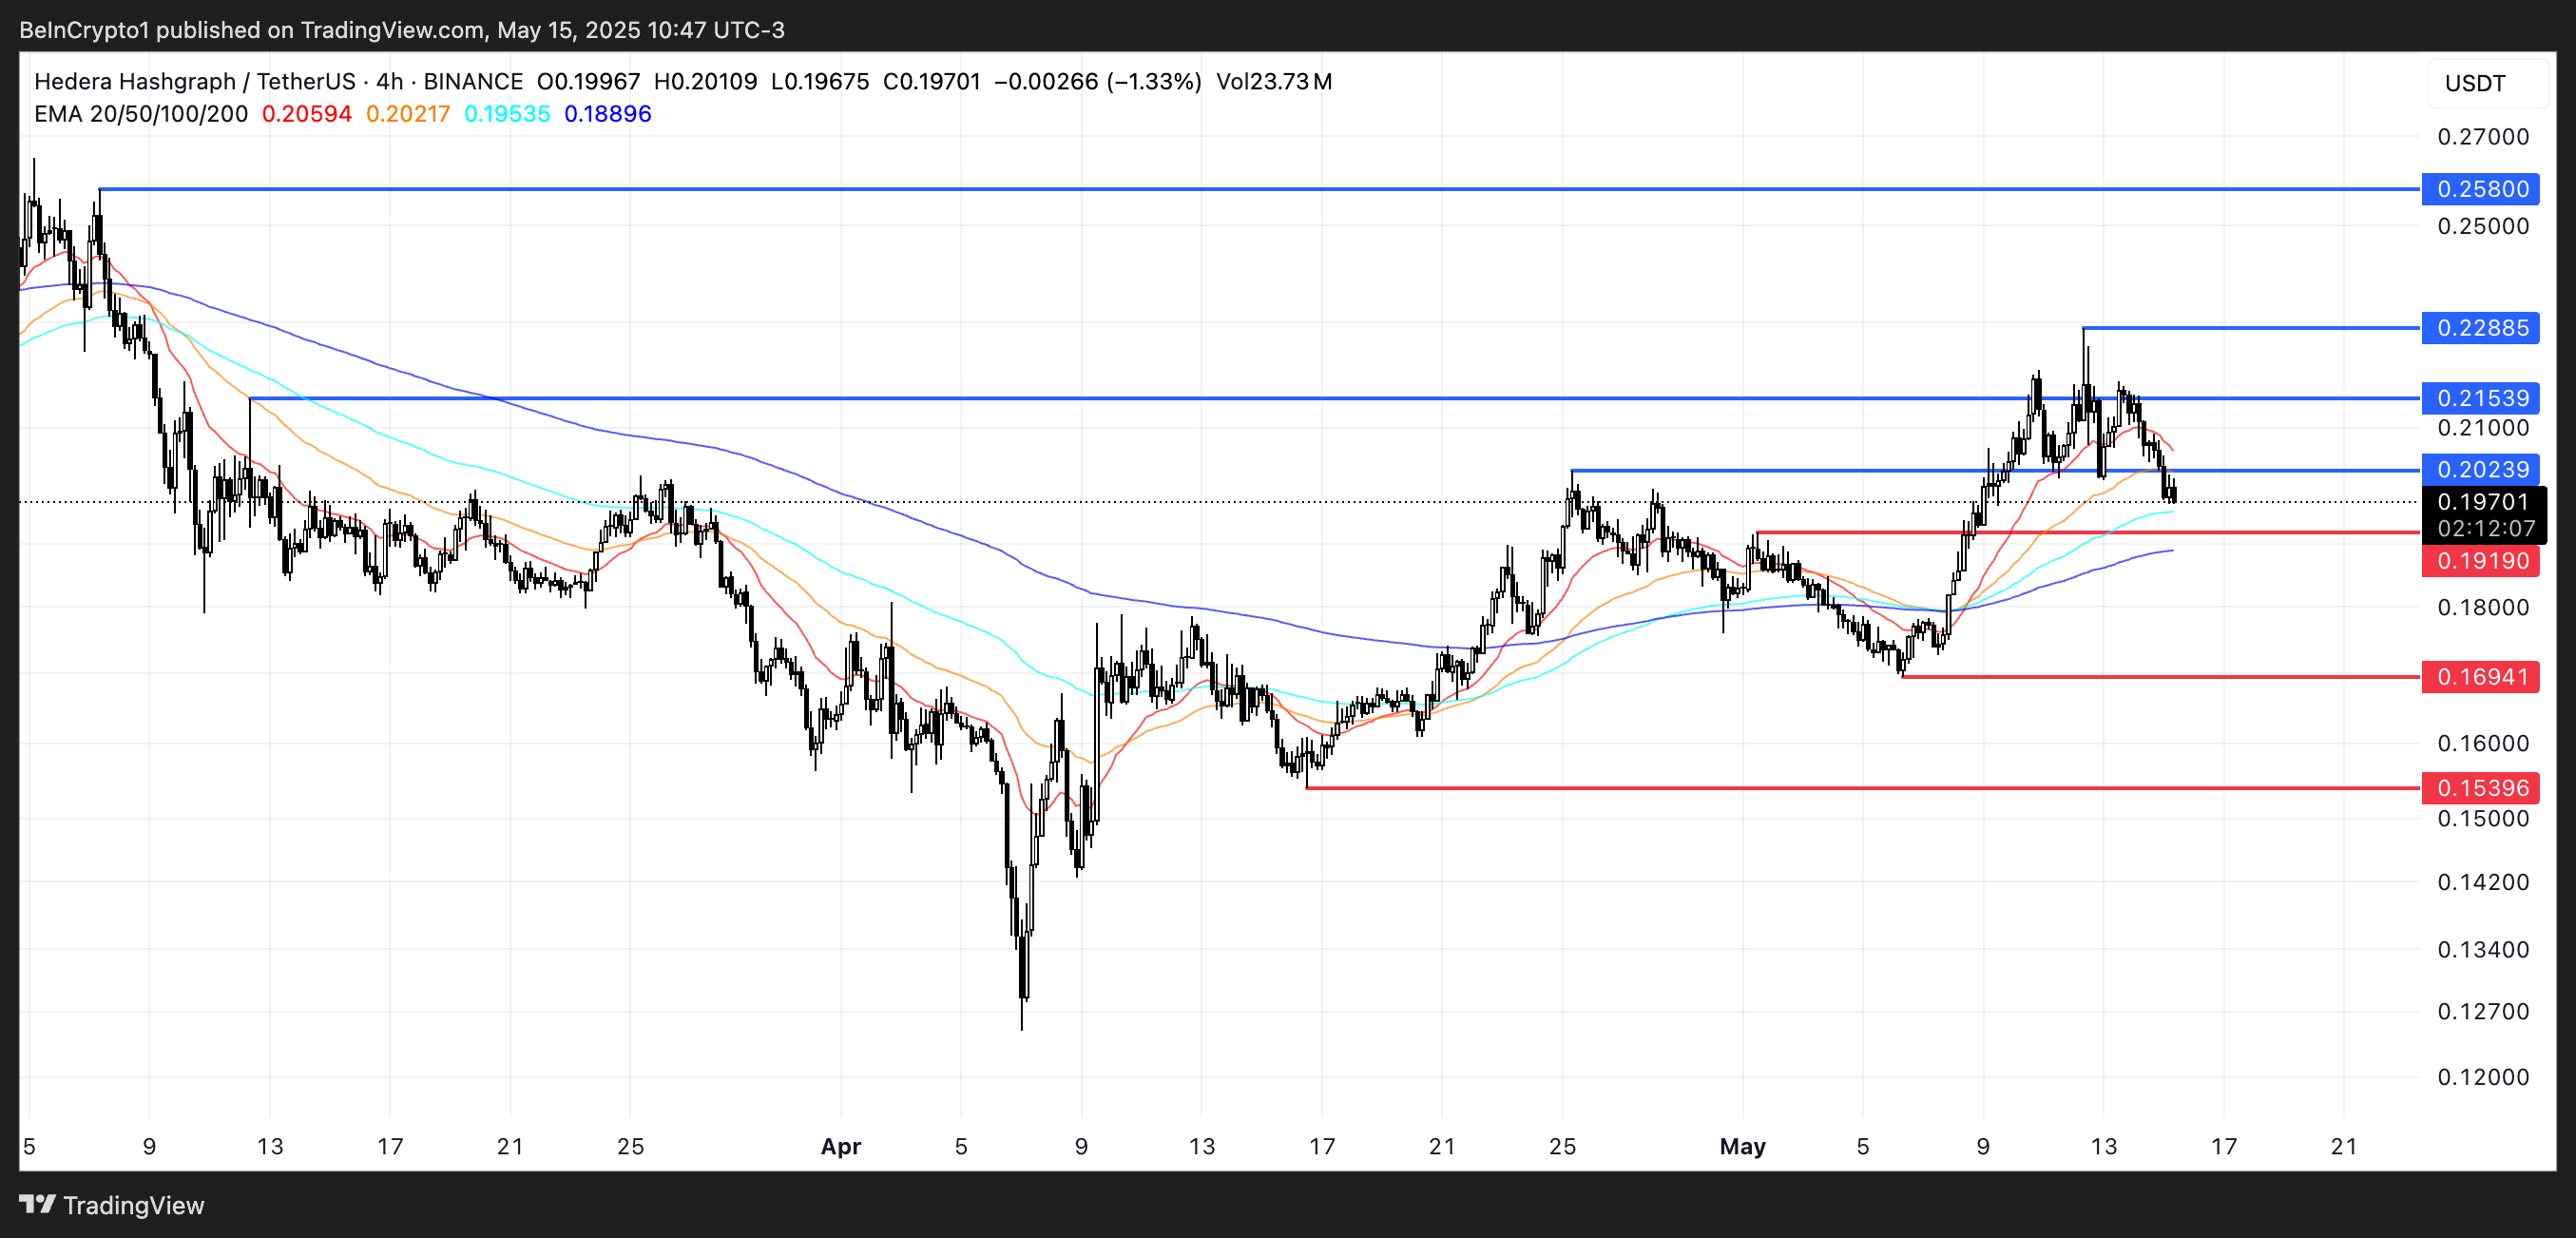
If HBAR loses the $0.191 support, selling pressure could drive it further down to $0.169 and potentially $0.153.
Conversely, if the $0.191 support holds and buyers return, HBAR could retest the $0.202 resistance. Breaking that zone could trigger continued ascent with upside targets of $0.215 and $0.228.
If momentum remains strong, Hedera could challenge $0.258, which would be its first break above the $0.25 level since early March.


