

Bitcoin (BTC) rose by 3.6% in the past 24 hours, breaking through $100,000 for the first time since February 3rd. This sharp increase reignited momentum across the market and drew renewed institutional attention.
From ETF inflows to large corporate holdings, traditional finance is now leading the narrative about Bitcoin's next move. As BTC aims for new highs, analysts are watching key technical levels and the potential shift in dominance to altcoins.
Institutions Eyeing Bitcoin's New High… Altcoins Awakening
Bitcoin's breakthrough of $100,000 challenges the long-standing market framework and sparks widespread debate about what comes next.
According to Ju Choi, CEO of CryptoQuant, the traditional Bitcoin cycle theory is outdated because institutional investors and ETF inflows are reshaping the ecosystem.
Companies like Strategy are holding over $53.9 billion in BTC, and with spot ETFs bringing in billions in net inflows, on-chain analysts are adapting to a new regime driven by traditional financial liquidity.
Meanwhile, mixed sentiments in the options market and rising futures interest reflect a maturing asset increasingly driven by macro factors and capital flows.
Simultaneously, momentum is shifting to altcoins. Raoul Pal suggests Bitcoin's dominance has peaked, which is the "Banana Zone"—a stage that triggers exponential altcoin growth. CoinMarketCap's Altcoin Season Index is now at 41, outside the "Bitcoin season" zone for the first time in months.
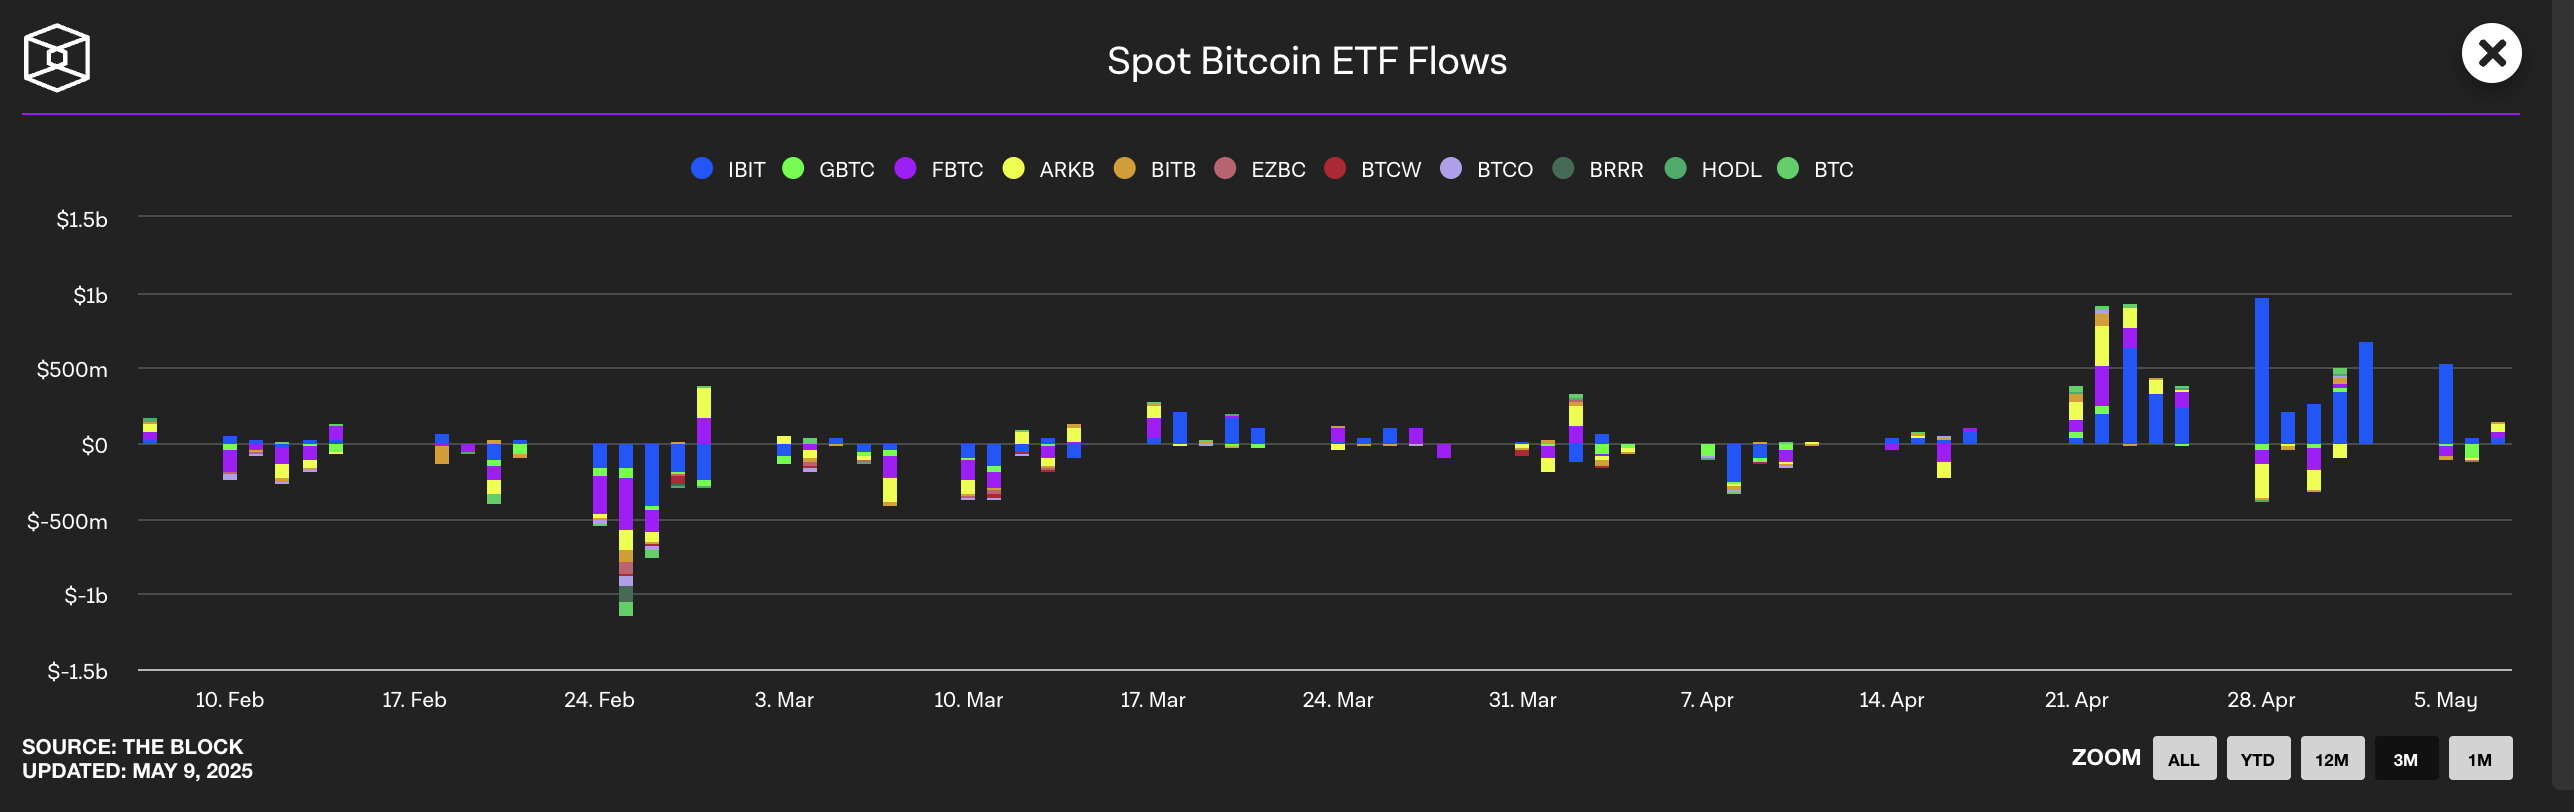
Institutional participation remains strong, with BlackRock and Fidelity's ETFs continuing to absorb capital.
Standard Chartered doubles down on the bullish outlook, predicting a new all-time high for BTC in Q2. This could be driven by ETF demand, sovereign fund adoption, and Strategy's plan to raise $84 billion, potentially pushing Bitcoin holdings to over 6% of total supply.
BTC Exchange Supply Drops Sharply Then Stabilizes… Maintaining Bullish Trend
From April 13th to April 25th, Bitcoin supply on exchanges saw a sharp and consistent decline, dropping from 1.49 million BTC to 1.43 million BTC. The 60,000 BTC decrease in 12 days is one of the most significant outflows in recent weeks, suggesting strong accumulation across the market.
The decrease in Bitcoin exchange supply is generally considered a bullish signal, indicating investors are moving BTC to cold storage or long-term holding, reducing immediately sellable amounts. Conversely, an increase in exchange supply could indicate selling pressure, suggesting more BTC is available for potential liquidation—a bearish signal.
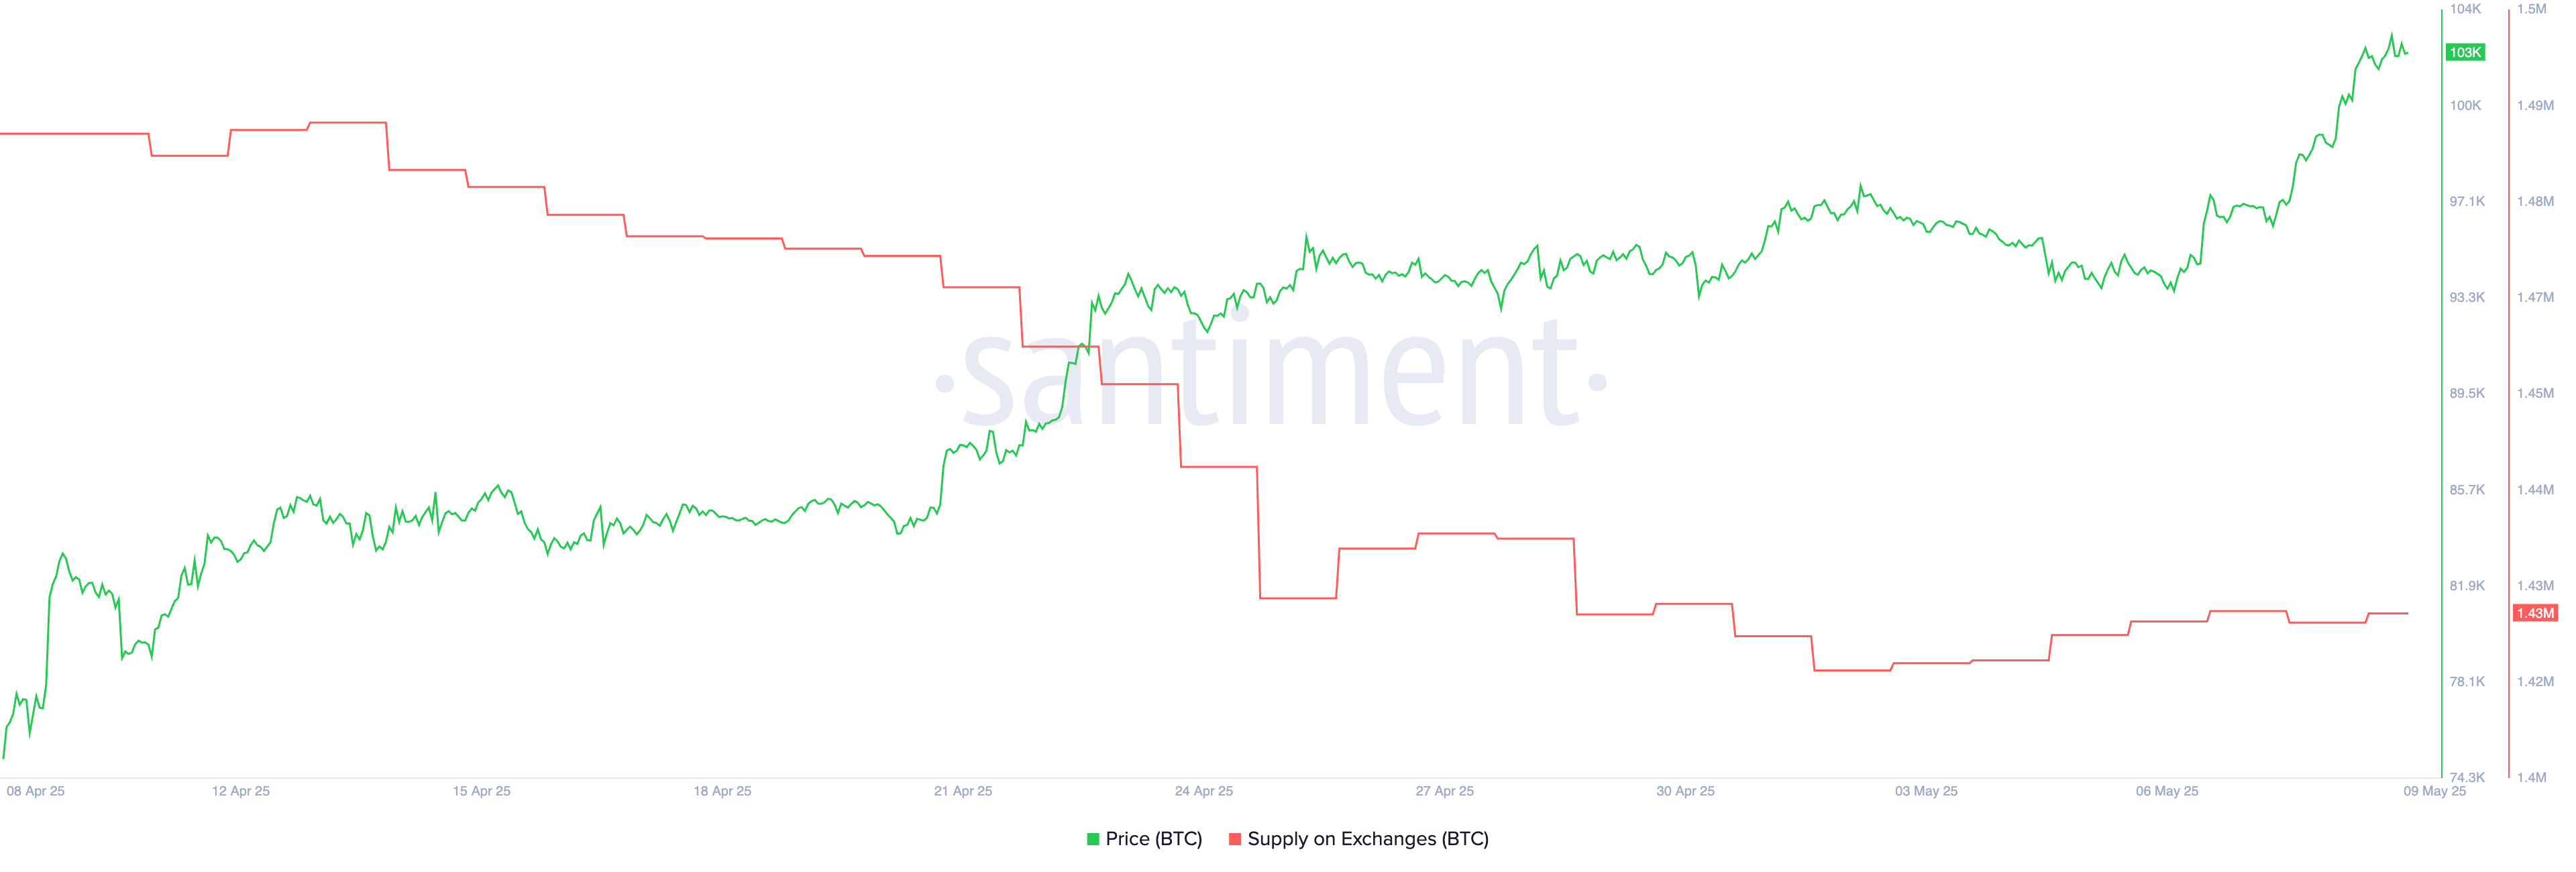
After the sharp decline, BTC exchange supply stabilized around 1.43 million. This adjustment suggests investors are maintaining their positions and not preparing to sell, which could support price strength in the short term.
Bitcoin's Ichimoku chart shows strong bullish momentum. The price is above the green cloud (Kumo), indicating a clear upward trend.
The conversion line (blue) and base line (red) are tilted upward, with the conversion line above the base line, further confirming bullishness.
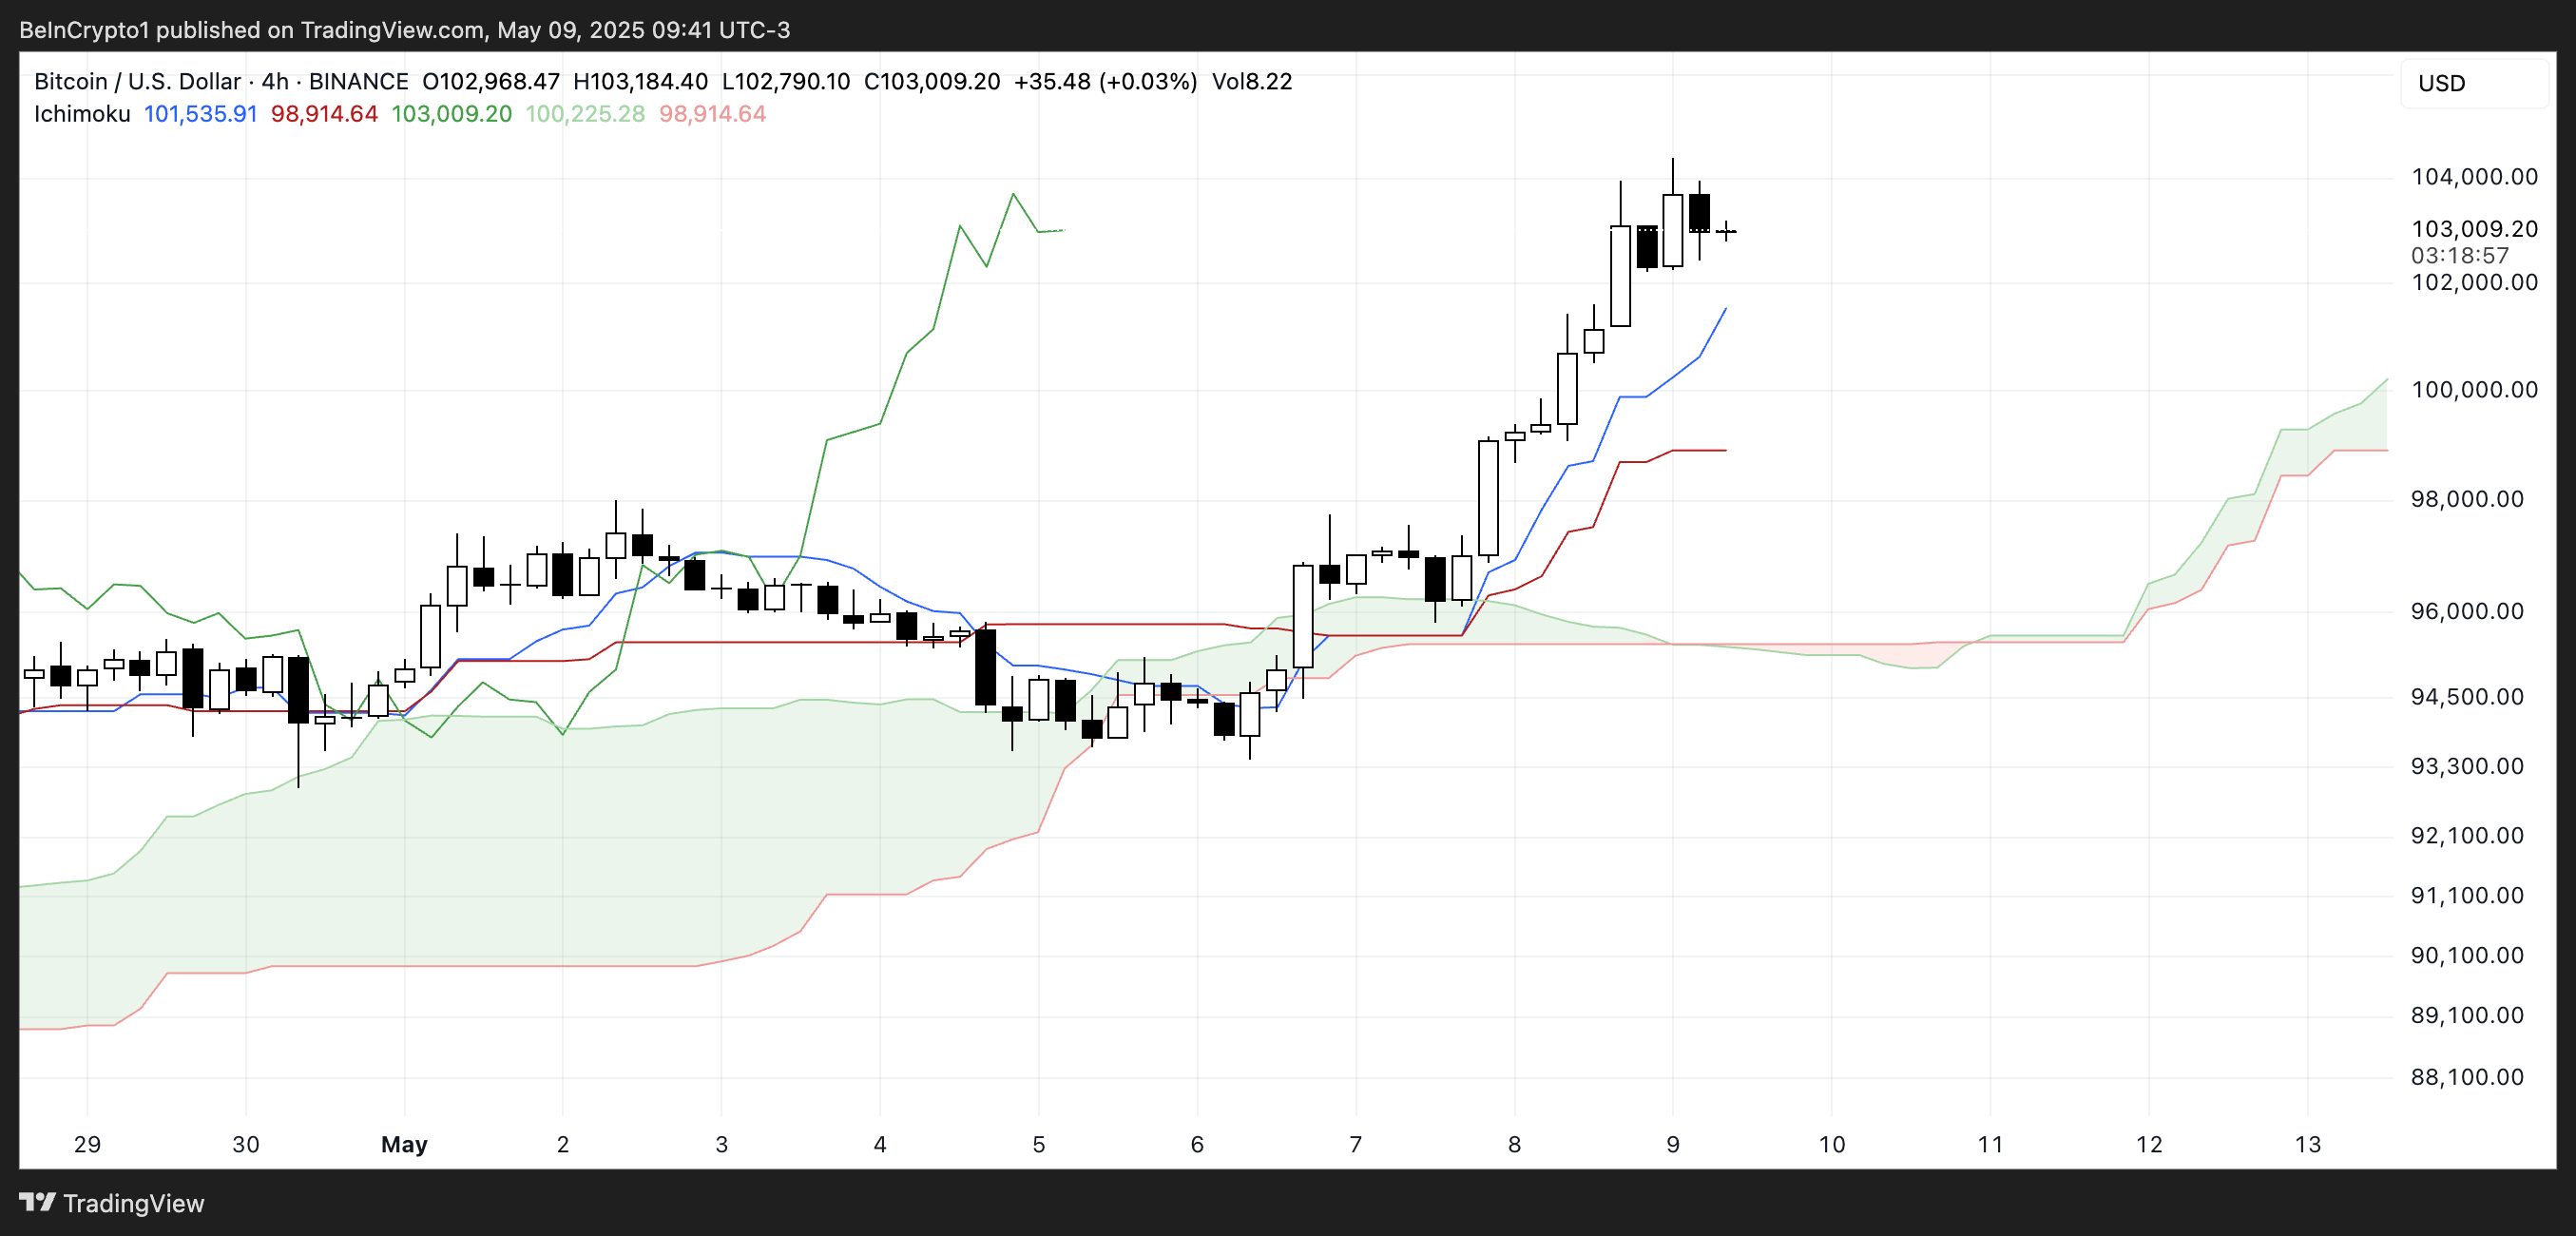
Leading Span A (top of green cloud) is above Leading Span B (bottom of cloud), and the future cloud is thick and rising, suggesting strong support levels and continued trend strength.
The lagging span (green line) is positioned above the cloud, further supporting the bullish outlook. Unless the price closes below the blue conversion line or the cloud thins or turns red, the bias remains strongly bullish.
Bitcoin Maintains Uptrend, $99,000 Support Line Crucial
Bitcoin's moving averages currently signal strong bullish momentum, with short-term averages positioned above long-term averages. If this uptrend continues, Bitcoin price could soon challenge the $106,296 resistance.
Successfully breaking that level could trigger a move to $109,312 and potentially open the first historical test of $110,000.
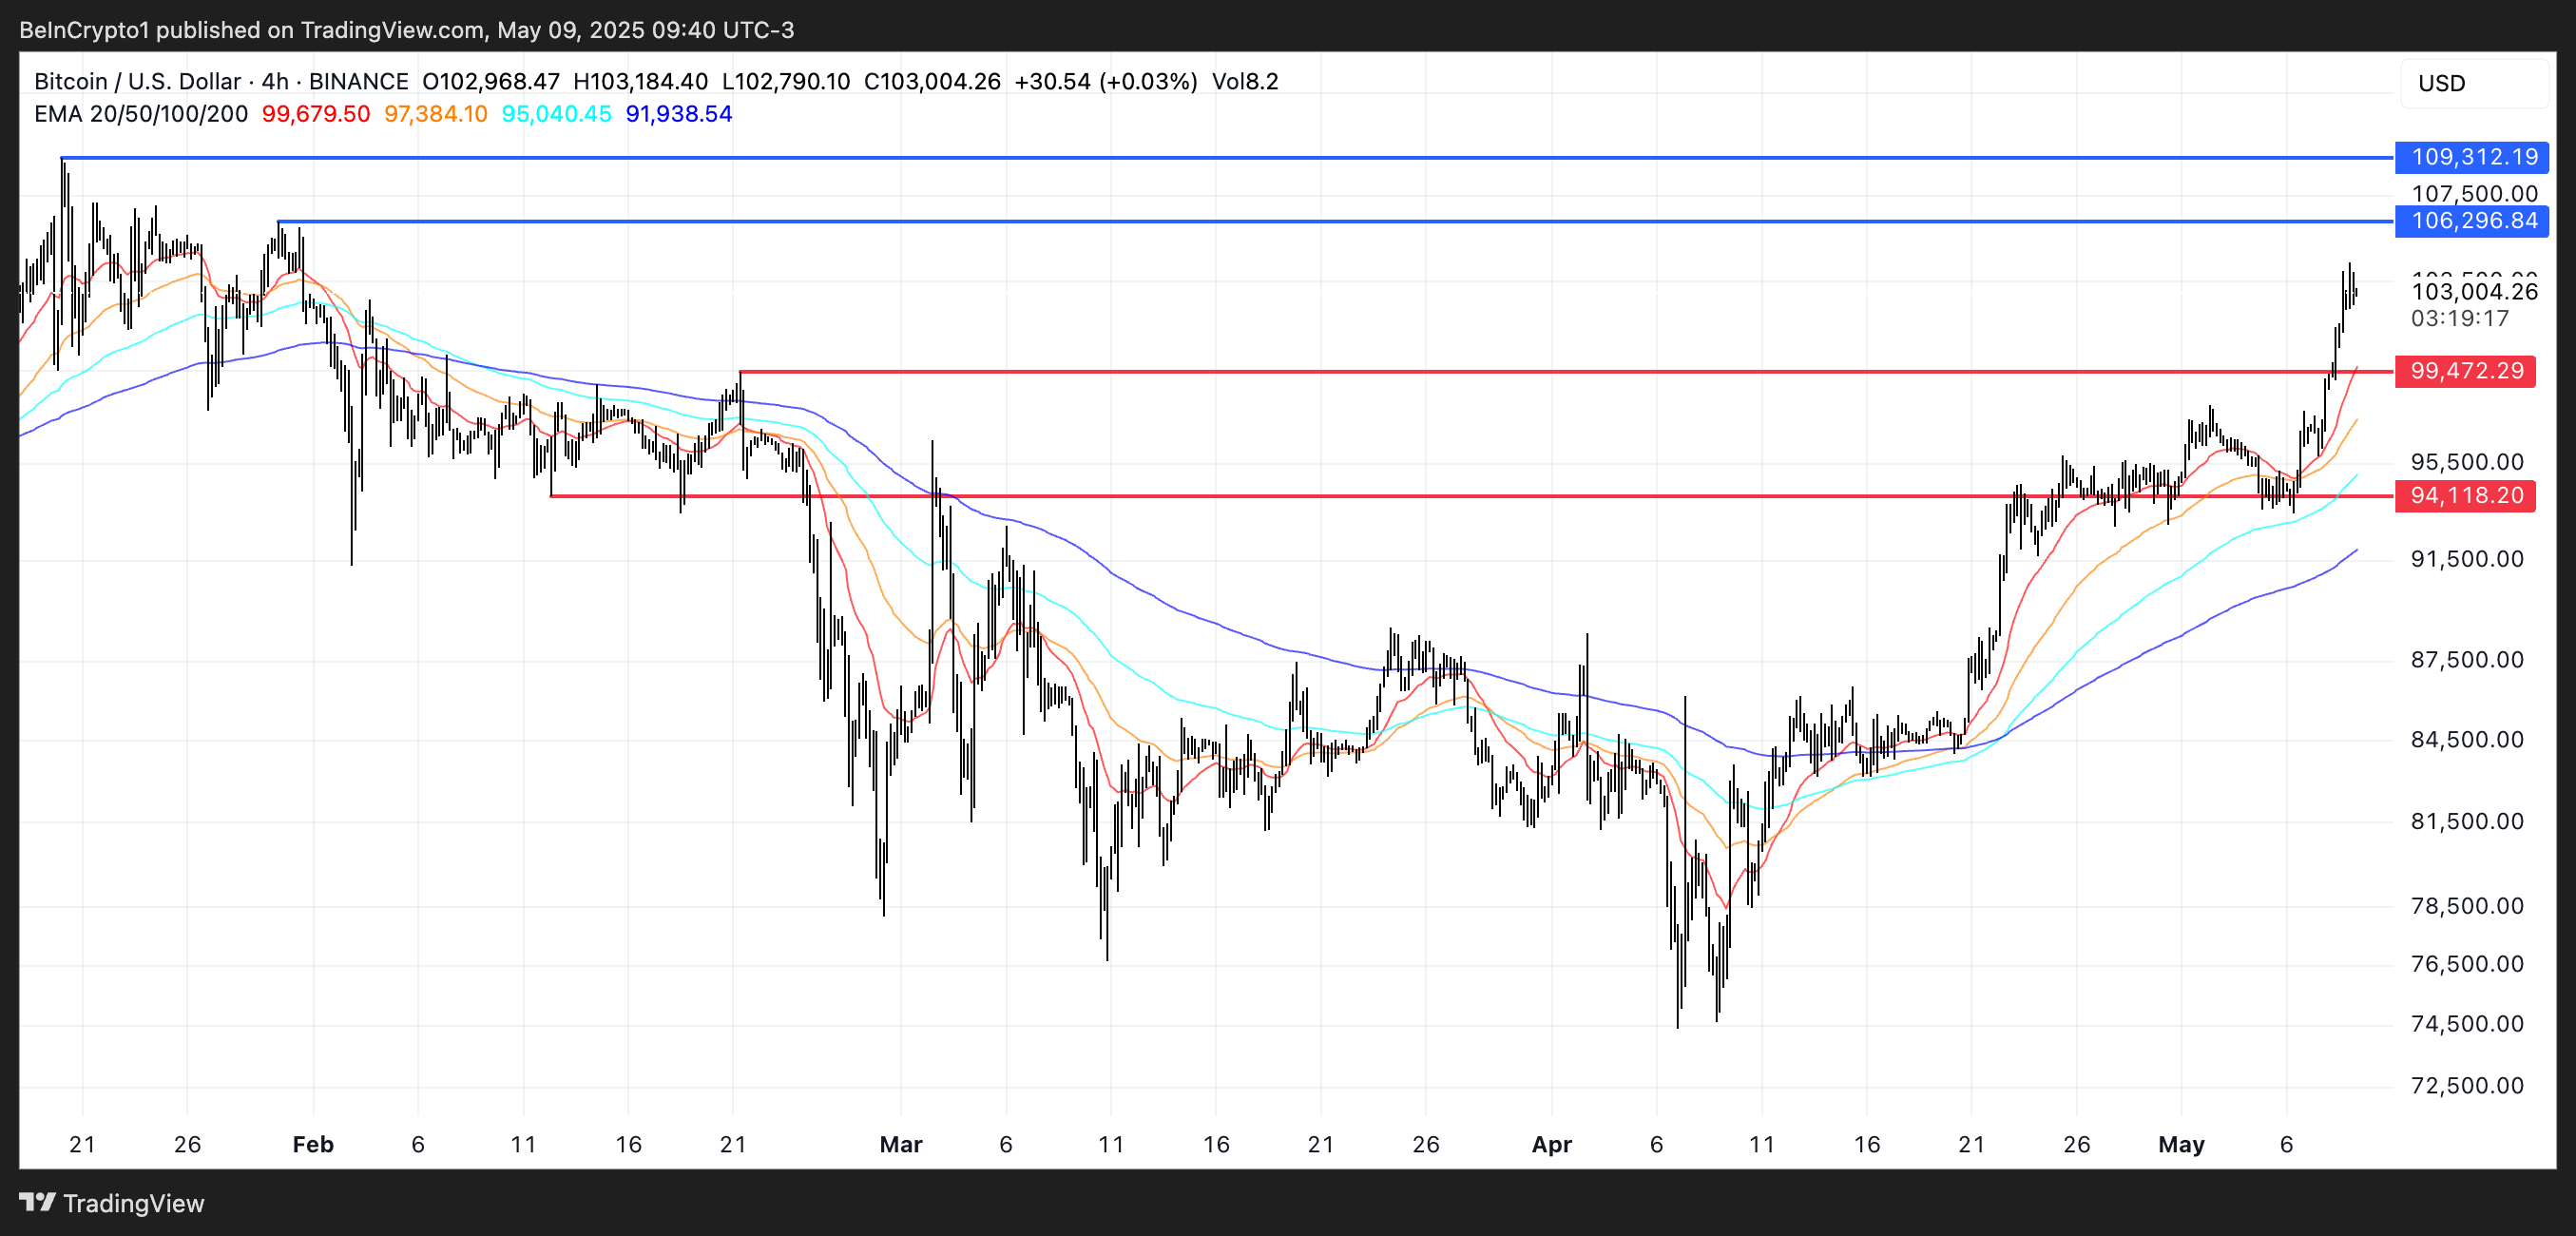
However, if Bitcoin loses its upward momentum, the key support line to watch is $99,472.
Falling below this support could change market sentiment and cause the price to drop to the next major support line at $94,118.


